Fig. 4.
Download original image
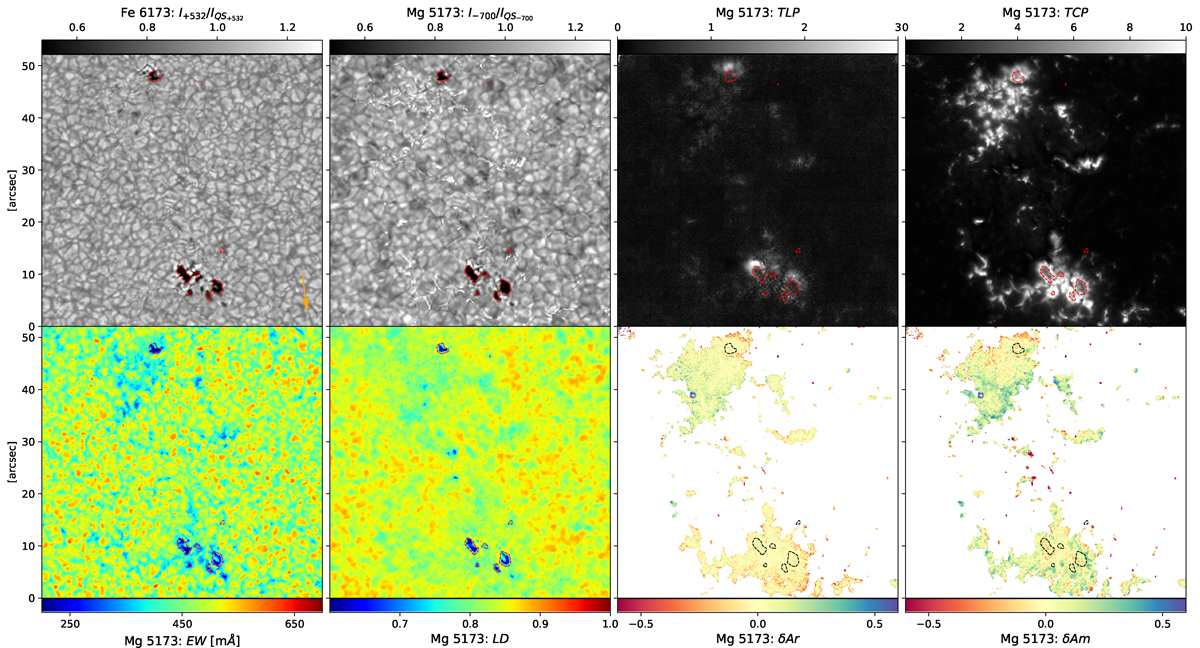
Spectral and polarization properties of the Mg I b2 line. Top: Reference continuum intensity in Fe (at +532 mÅ) normalized to its mean QS value I+532/IQS+532, continuum intensity in Mg (at −700 mÅ from the line core) normalized to its mean QS value I−700/IQS−700, and maps of TLP and TCP. Bottom: EW, LD, δAr, and δAm. The regions with Stokes V signals smaller than 5σ have been masked in the maps of the Stokes V asymmetries. Dashed contours are placed at I−700 = 0.5IQS−700 of the Mg line to highlight the pore locations, and the orange arrow in the first panel points toward the disc center.
Current usage metrics show cumulative count of Article Views (full-text article views including HTML views, PDF and ePub downloads, according to the available data) and Abstracts Views on Vision4Press platform.
Data correspond to usage on the plateform after 2015. The current usage metrics is available 48-96 hours after online publication and is updated daily on week days.
Initial download of the metrics may take a while.