Fig. 2.
Download original image
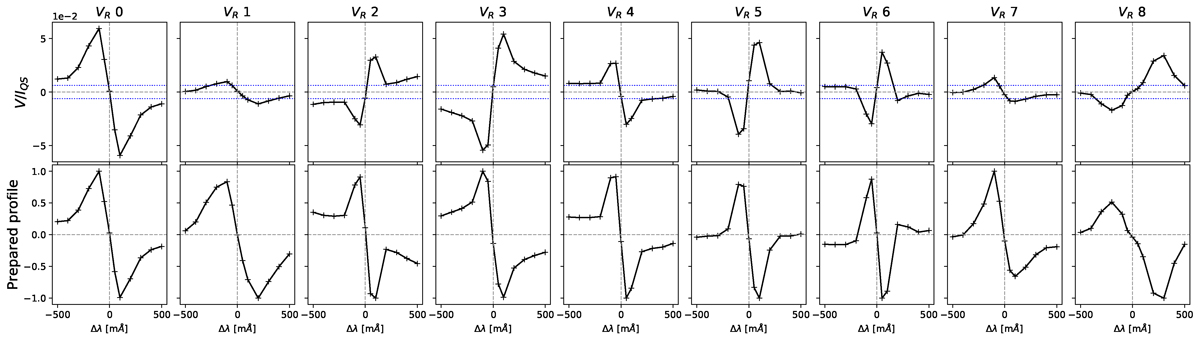
Nine Stokes V representative profiles from the Mg dataset. The top panels show the profiles normalized to IQS (at −700 mÅ). The gray dashed lines were placed at zero and the blue dotted lines show the ±5σ level. The bottom panels show the representative profiles after Doppler-shift removal, renormalization, and polarity adjustment as explained in the main text.
Current usage metrics show cumulative count of Article Views (full-text article views including HTML views, PDF and ePub downloads, according to the available data) and Abstracts Views on Vision4Press platform.
Data correspond to usage on the plateform after 2015. The current usage metrics is available 48-96 hours after online publication and is updated daily on week days.
Initial download of the metrics may take a while.