Open Access
Fig. 1.
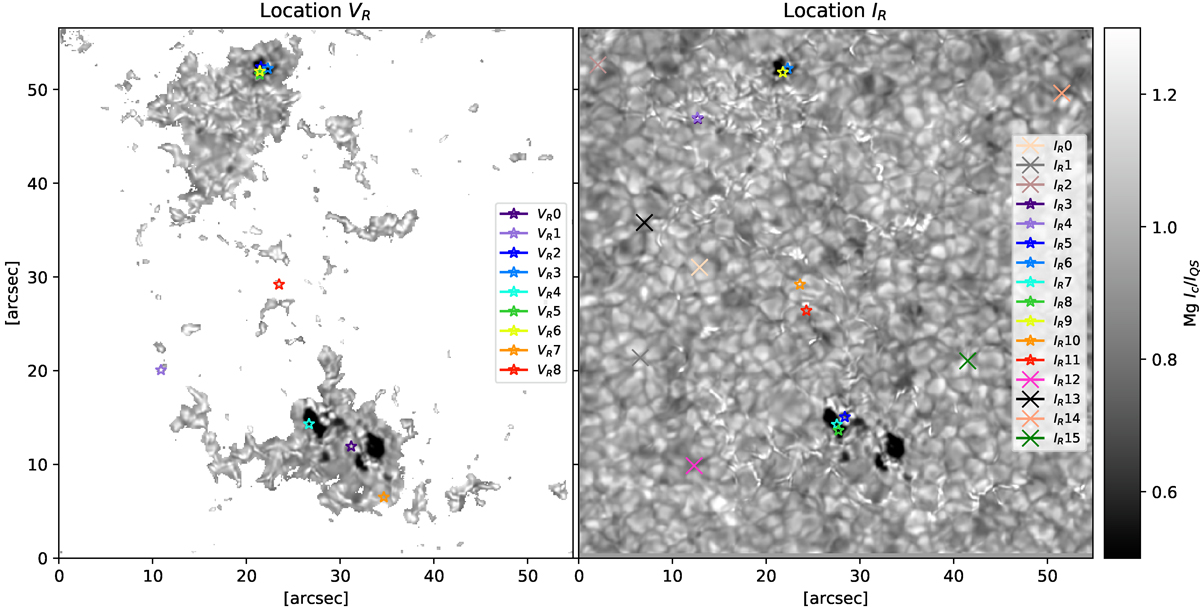
Download original image
Location of the nine representative profiles for Stokes V (left) and of the 16 representative profiles for Stokes I (right) on the Mg intensity maps normalized to the mean quiet Sun value IQS (at −700 mÅ). The left panel shows only regions where the circular polarization signals are above the 5σ level.
Current usage metrics show cumulative count of Article Views (full-text article views including HTML views, PDF and ePub downloads, according to the available data) and Abstracts Views on Vision4Press platform.
Data correspond to usage on the plateform after 2015. The current usage metrics is available 48-96 hours after online publication and is updated daily on week days.
Initial download of the metrics may take a while.