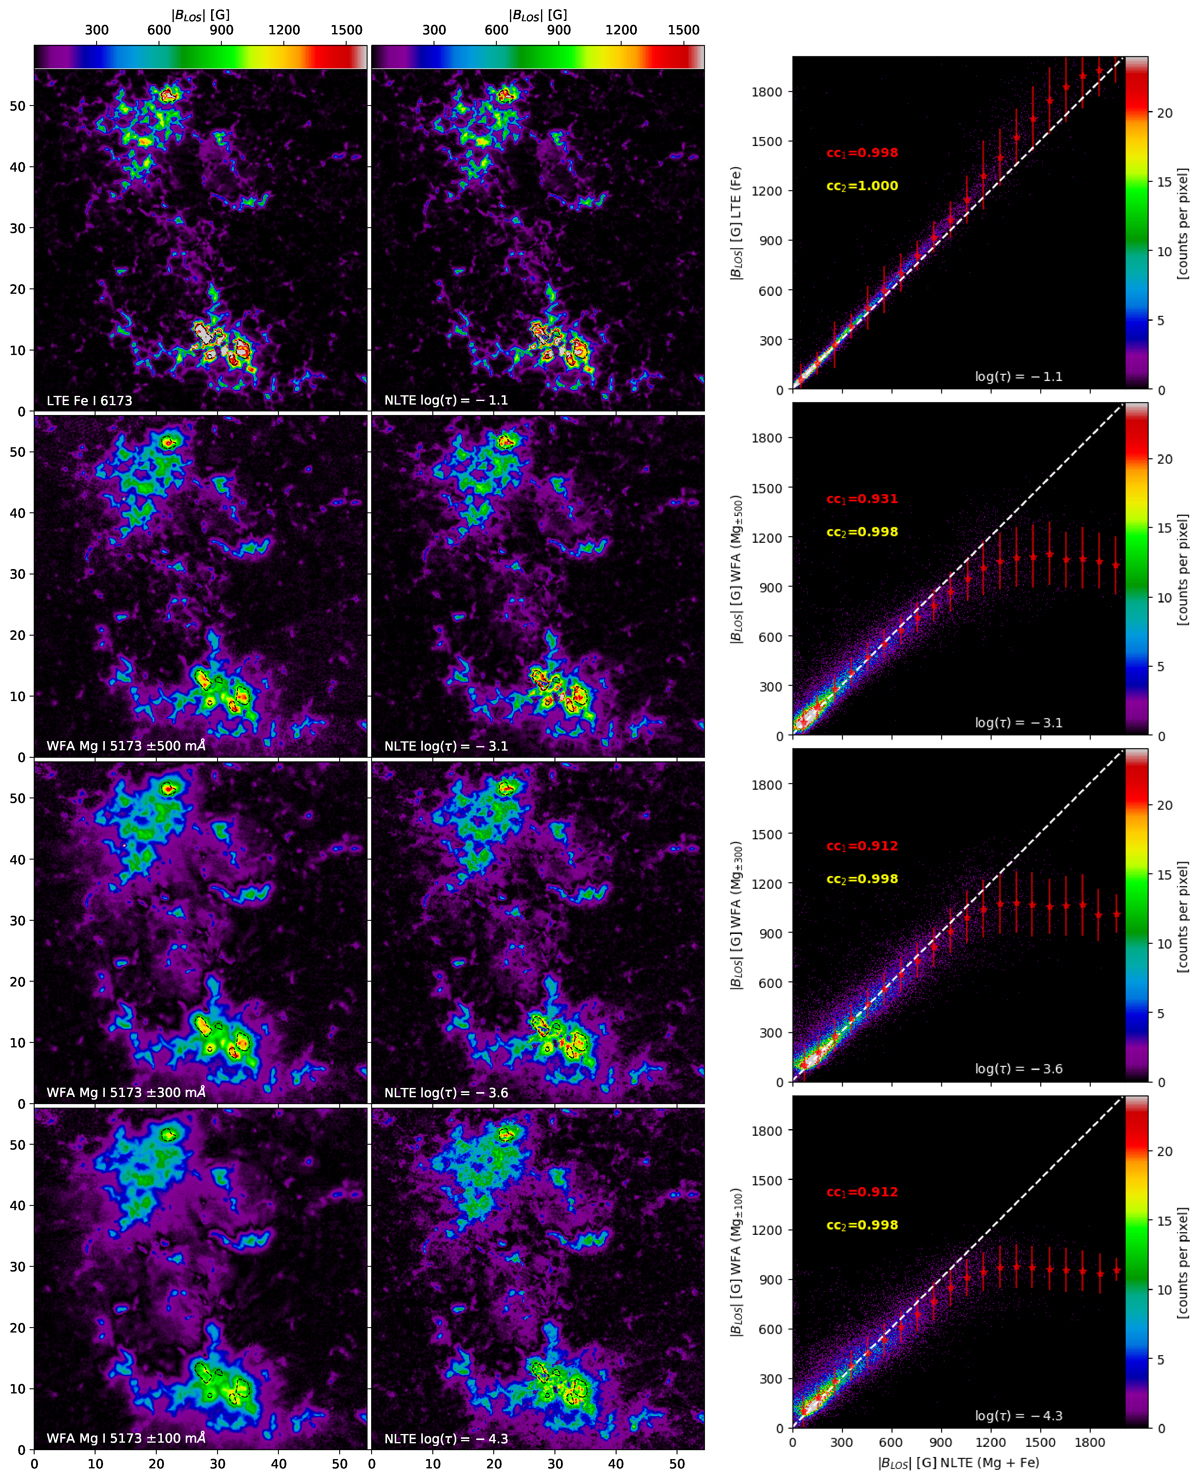
Fig. 9.
Download original image
Height variation of the longitudinal magnetic field, comparing results from the different methods. In the left column we show the traditional methods (from top to bottom): LTE inversion of the Fe I 6173 Å line, and WFA applied to the Mg I 5173 Å line within the spectral windows of ±500 mÅ, ±300 mÅ, and ±100 mÅ. In the center we show NLTE inversion at different optical depths, selected based on the maximum cross-correlation with the corresponding left maps, and in the right scatter plots comparing the results from the different methods, excluding |BLOS| values obtained from Stokes V profiles with signals below the 5σ level. Black contours on the left and central maps show the position of the pores. The dashed white lines in the scatter plots represent identity lines, and the red markers indicate the average values of the distribution in x-bins of 100 G. The red vertical lines depict the standard deviation along the y-axis for each 100 G bin on the x-axis. Two correlation coefficients are provided in each scatter plot: cc1 for the entire distribution and cc2 for |BLOS|< 1000 G.
Current usage metrics show cumulative count of Article Views (full-text article views including HTML views, PDF and ePub downloads, according to the available data) and Abstracts Views on Vision4Press platform.
Data correspond to usage on the plateform after 2015. The current usage metrics is available 48-96 hours after online publication and is updated daily on week days.
Initial download of the metrics may take a while.