Fig. 8.
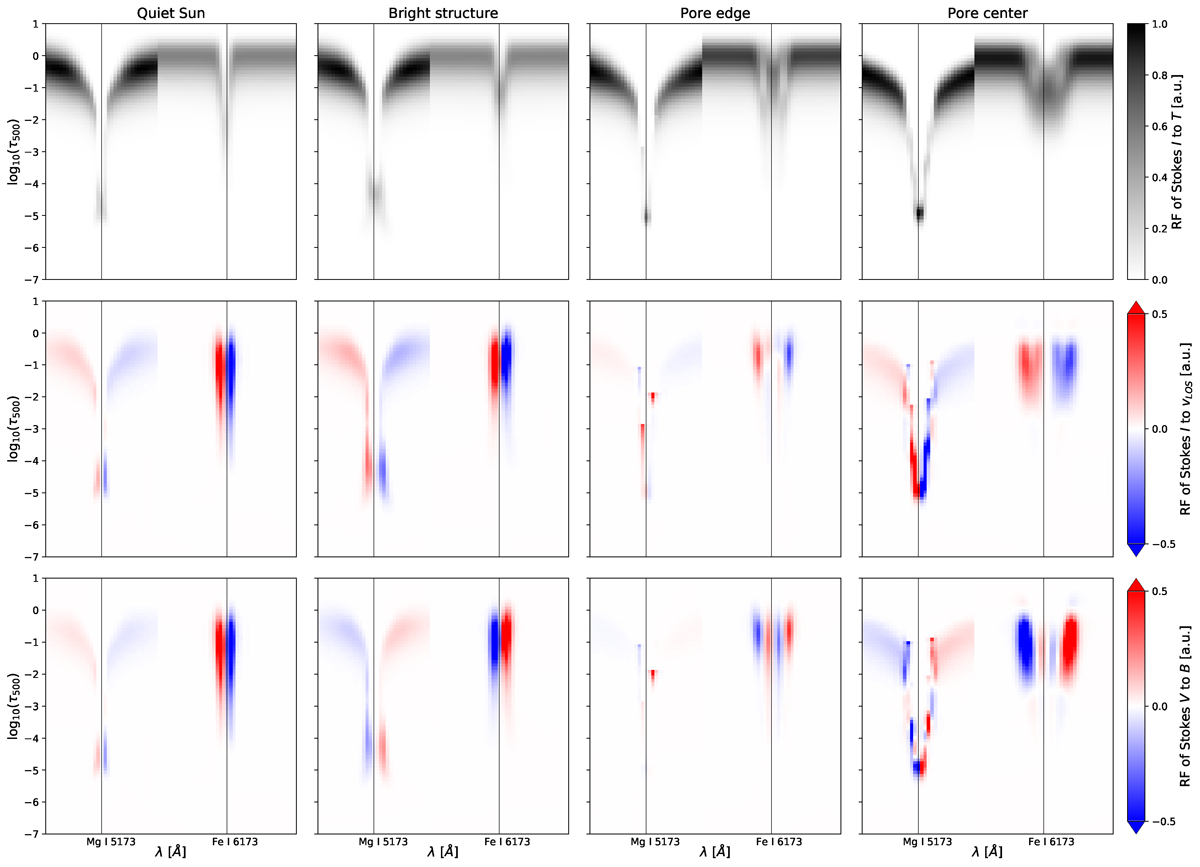
Download original image
NLTE RFs computed for the different sets of Stokes profiles and resulting atmospheres shown in Figs. 6 and 7, respectively. From top to bottom, the maps show the RF of Stokes I to changes in temperature, of Stokes I to changes in LOS velocity, and of Stokes V to changes in the magnetic field strength. All maps are normalized to their maximum value.
Current usage metrics show cumulative count of Article Views (full-text article views including HTML views, PDF and ePub downloads, according to the available data) and Abstracts Views on Vision4Press platform.
Data correspond to usage on the plateform after 2015. The current usage metrics is available 48-96 hours after online publication and is updated daily on week days.
Initial download of the metrics may take a while.