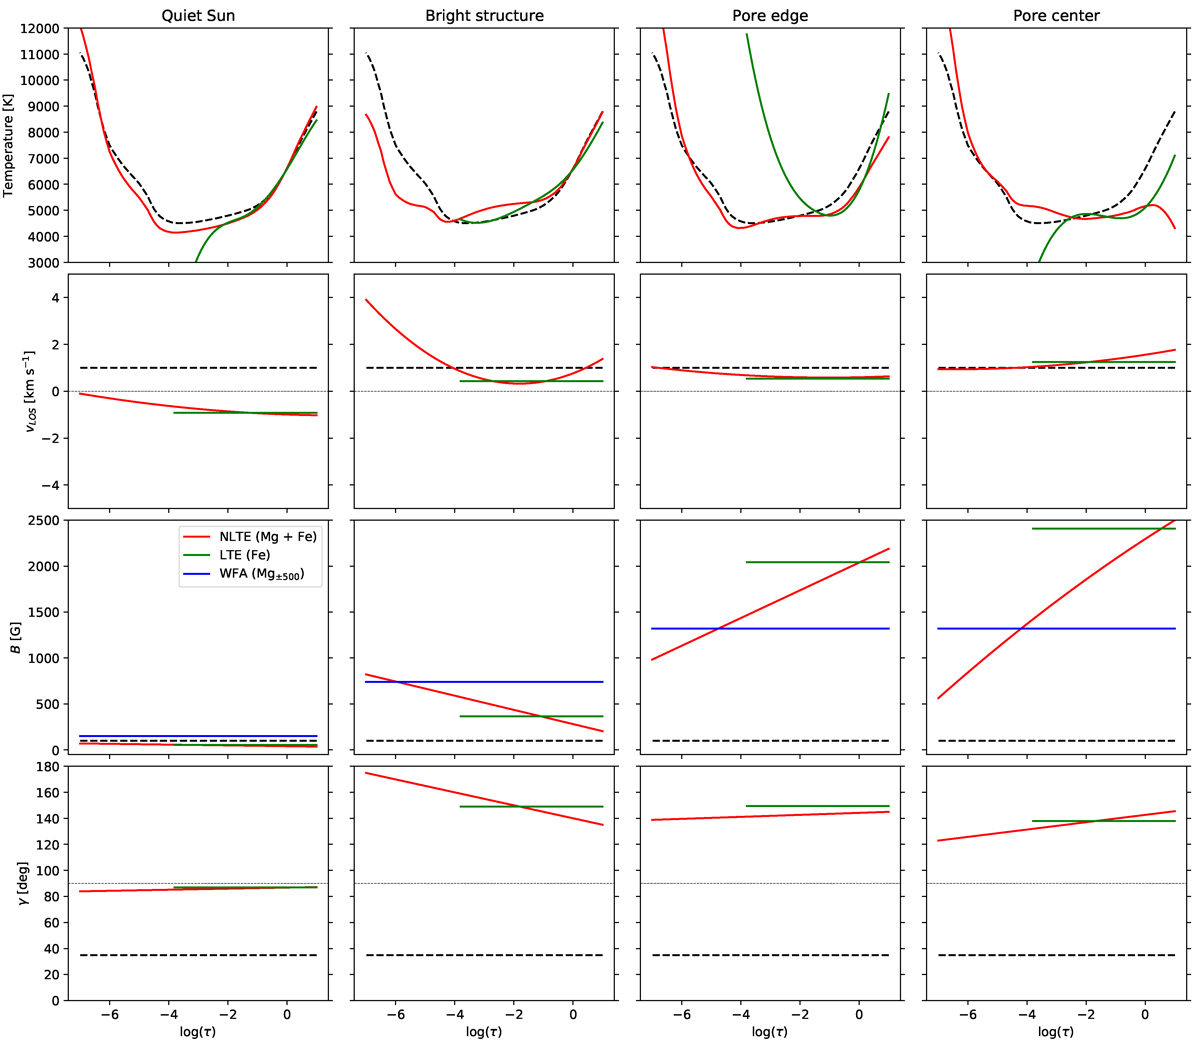
Fig. 7.
Download original image
Atmospheric stratifications obtained with the different methods for the Stokes profiles shown in Fig. 6: the initial FALC model (dashed black lines) and the results from the two-line NLTE inversions (red lines), from the WFA using the spectral region ±500 mÅ around the Mg line core (blue), and from the LTE inversion of the Fe line (green). Panels display, from top to bottom, the temperature in K, the LOS velocity in km s−1, the magnetic field strength in G, and the magnetic field inclination in degree.
Current usage metrics show cumulative count of Article Views (full-text article views including HTML views, PDF and ePub downloads, according to the available data) and Abstracts Views on Vision4Press platform.
Data correspond to usage on the plateform after 2015. The current usage metrics is available 48-96 hours after online publication and is updated daily on week days.
Initial download of the metrics may take a while.