Fig. 6.
Download original image
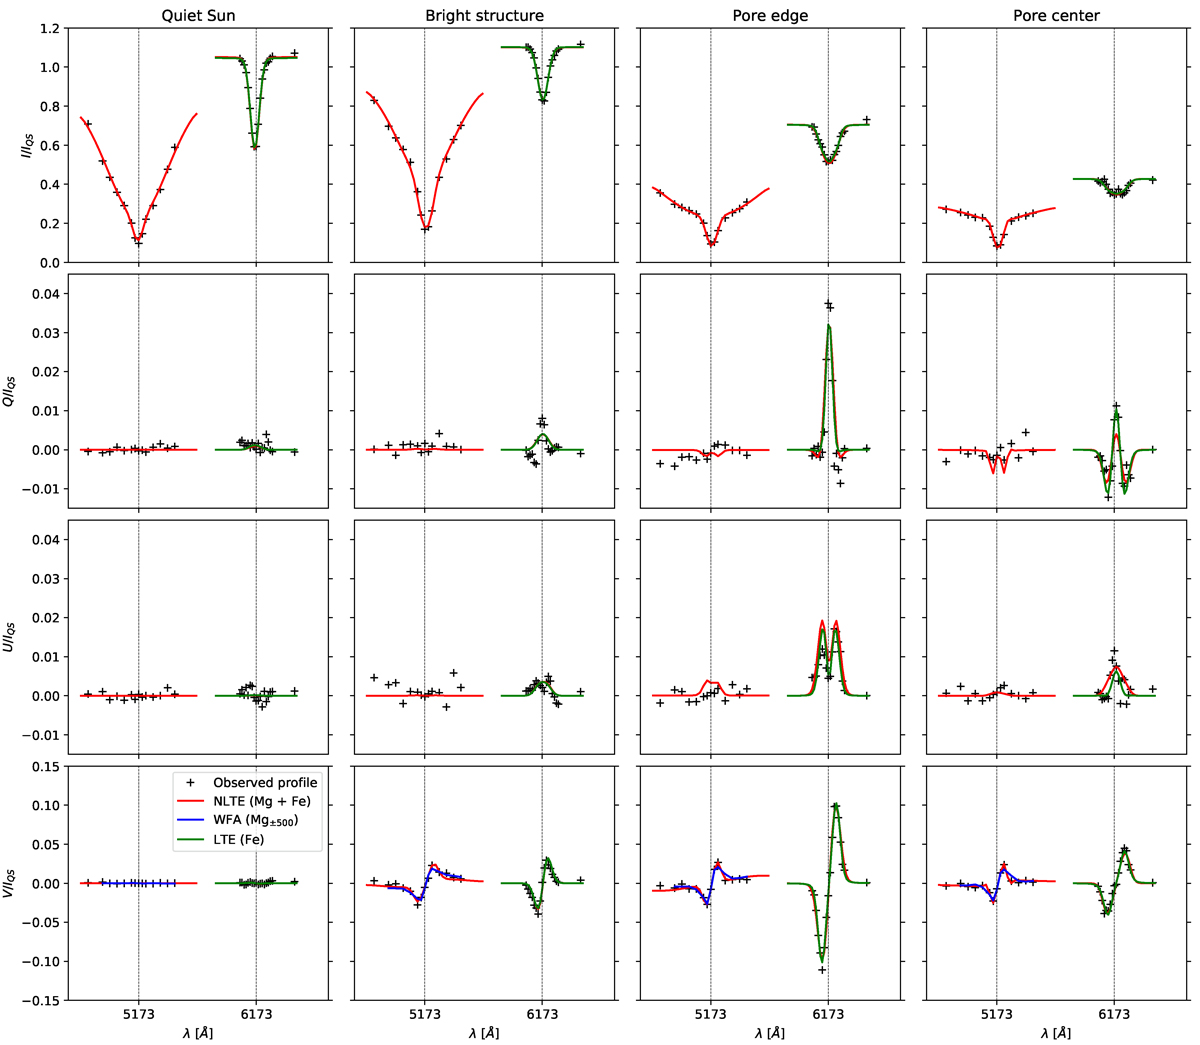
Examples of Stokes profiles from different regions in the FOV (black markers) and best fits obtained with the different methods: two-line NLTE inversions (red lines), WFA using the spectral region ±500 mÅ around the Mg line core (blue), and LTE inversion of the Fe line (green). Panels display, from top to bottom, the Stokes I, Q, U, and V profiles normalized to the average continuum intensity in the quiet Sun, IQS. From left to right, each set of Stokes profiles corresponds to a pixel in the quiet Sun, in a bright magnetic structure, in a pore, and in a pore’s center. The resulting atmospheric stratifications are shown in Fig. 7.
Current usage metrics show cumulative count of Article Views (full-text article views including HTML views, PDF and ePub downloads, according to the available data) and Abstracts Views on Vision4Press platform.
Data correspond to usage on the plateform after 2015. The current usage metrics is available 48-96 hours after online publication and is updated daily on week days.
Initial download of the metrics may take a while.