Fig. 3.
Download original image
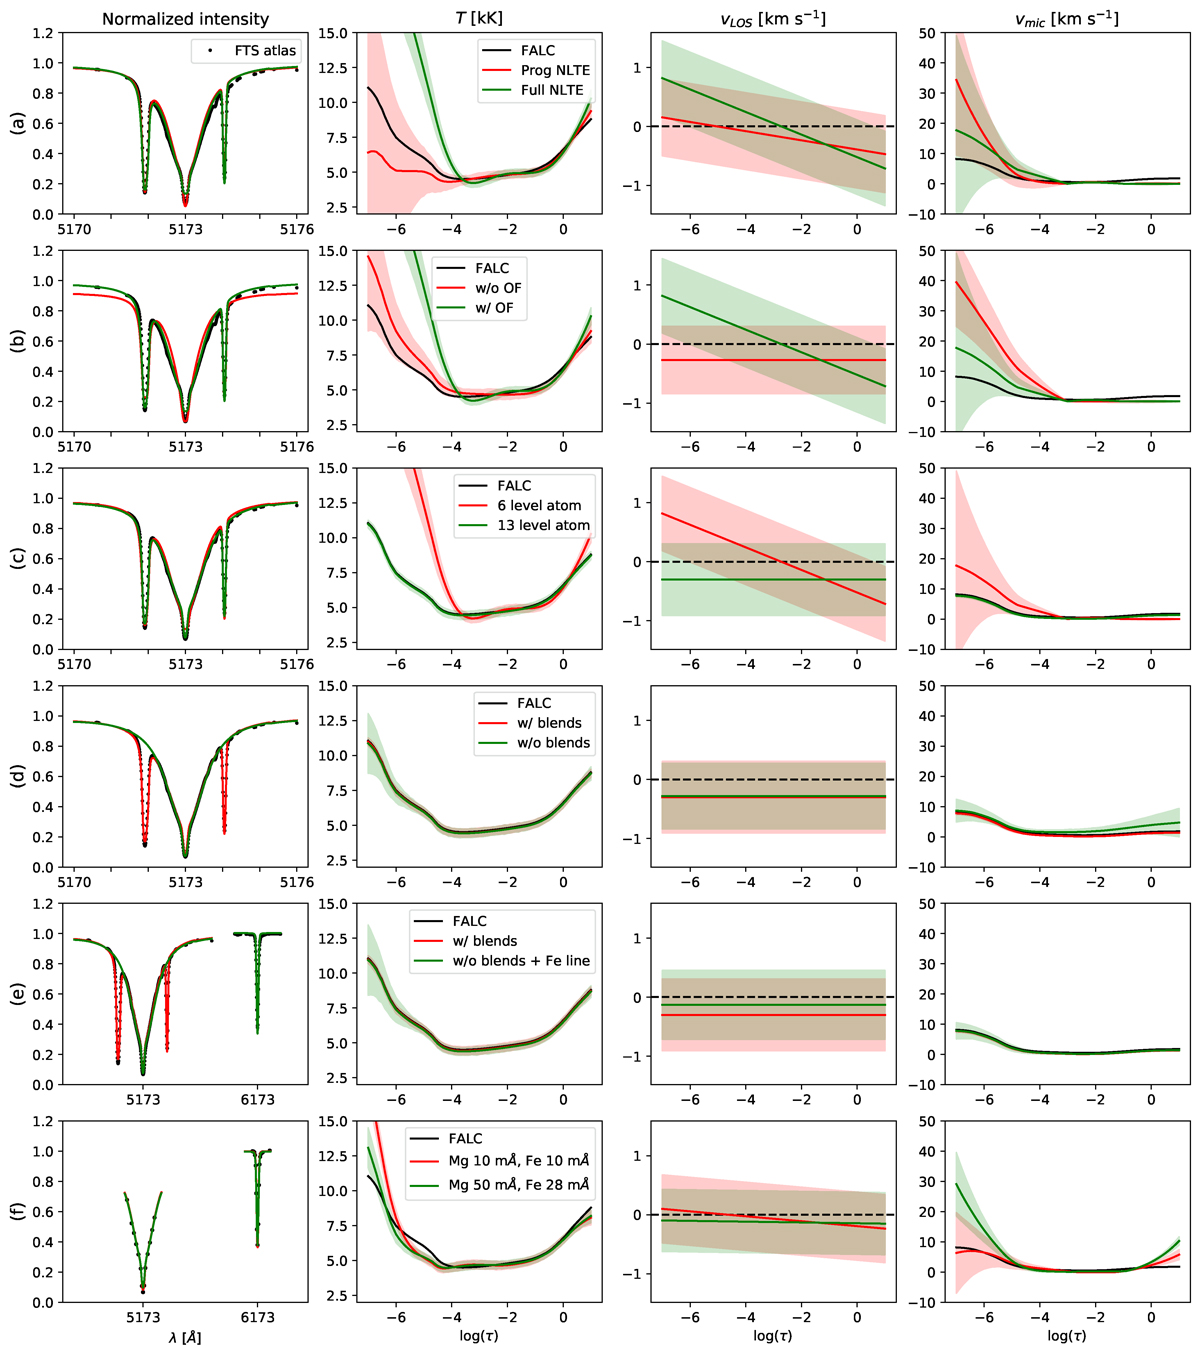
NLTE inversions of the FTS atlas profiles using different setups. The FTS profiles are shown with black dots and have a wavelength sampling of 10 mÅ for both the Mg I 5173 Å and Fe I 6173 Å lines, except for one of the inversions in the last row, as specified in the legends. The best-fit profiles and the resulting atmospheric stratification from the different inversions are presented with colored solid lines, and the shaded areas indicate the estimated uncertainties. Each row compares the following setups: (a) a progressive NLTE inversion (test 1, red lines) versus a full NLTE inversion (test 2, green); (b) the effects of including OF (test 3, red) versus not using OF (test 2, green); (c) an inversion using the 6-level Mg atomic model (test 2, red) versus an inversion using the 13-level Mg atomic model (test 4, green); (d) the inclusion of some Mg blends (test 4, red) versus their exclusion (test 5, green); (e) the inclusion of Mg blends (test 4, red) versus their exclusion but including the photospheric Fe 6173 Å line instead (test 6, green); and finally, the effect of wavelength sampling in a smaller spectral window of ±800 mÅ in Mg and ±560 mÅ in Fe, comparing a spectral grid of 10 mÅ in both lines (test 7, red) to a grid similar to our SST observations with a step of 50 mÅ for Mg and 28 mÅ for Fe (test 8, green). For the detailed configuration used in each of these inversion tests, refer to Table 3.
Current usage metrics show cumulative count of Article Views (full-text article views including HTML views, PDF and ePub downloads, according to the available data) and Abstracts Views on Vision4Press platform.
Data correspond to usage on the plateform after 2015. The current usage metrics is available 48-96 hours after online publication and is updated daily on week days.
Initial download of the metrics may take a while.