Fig. 1.
Download original image
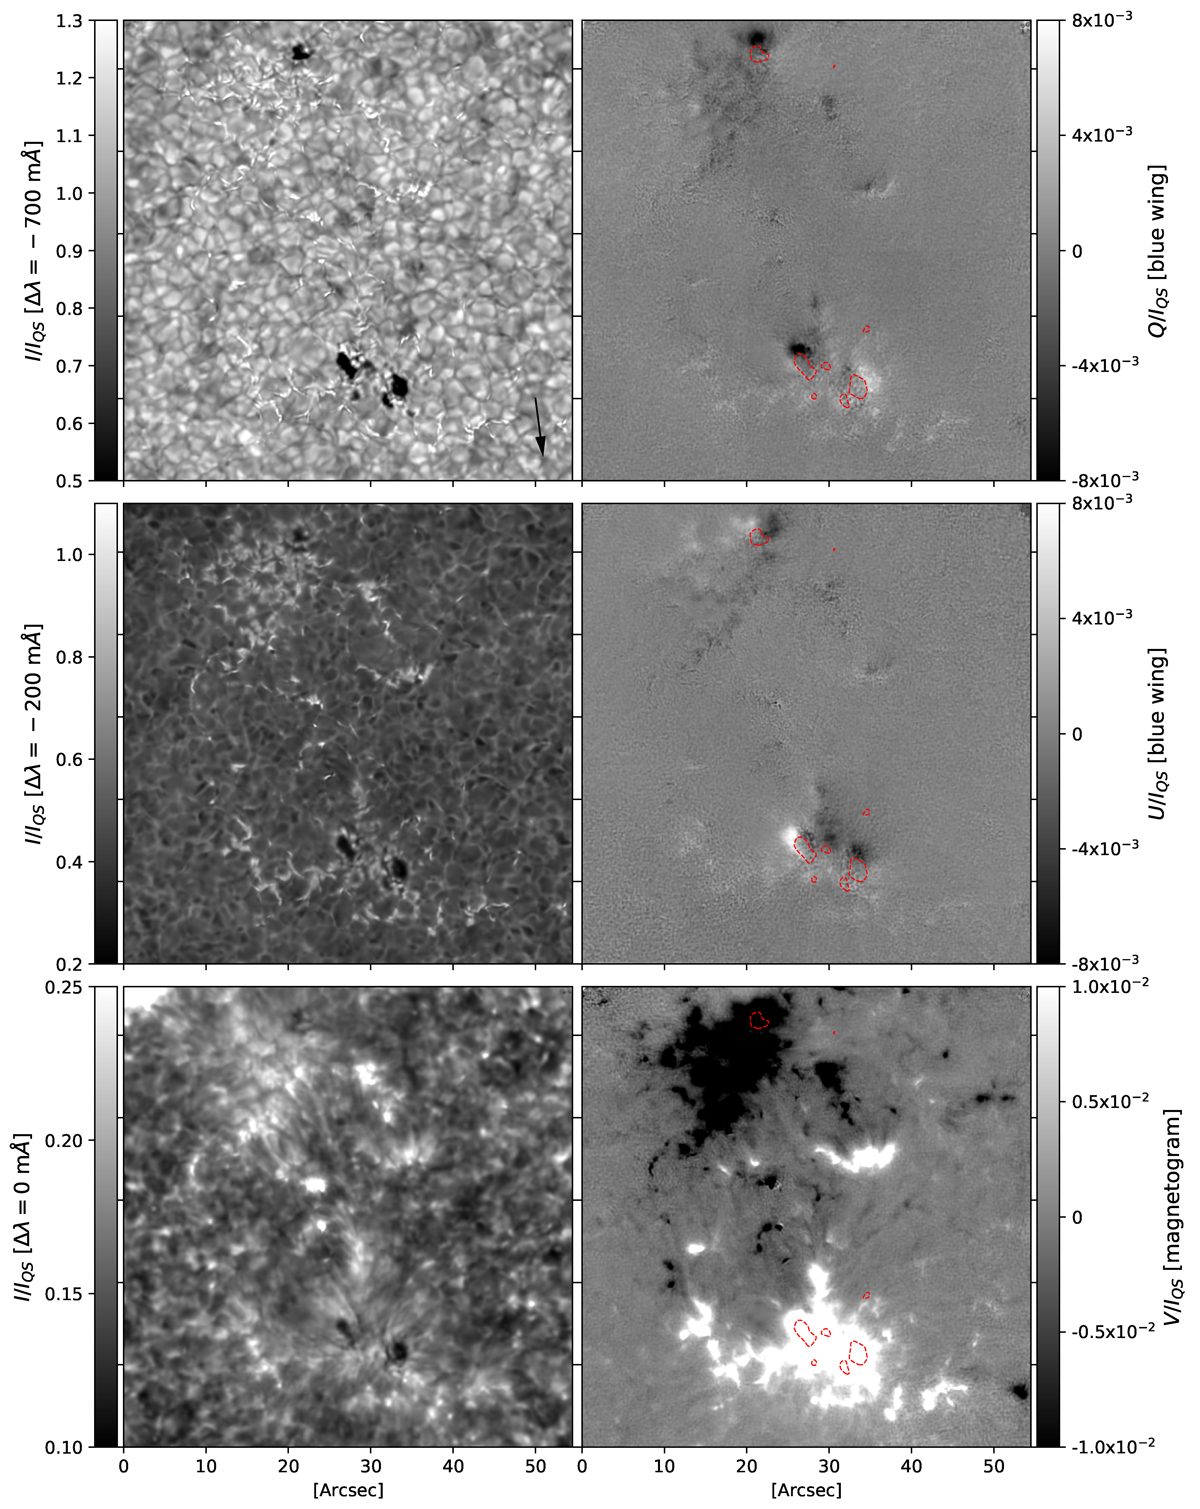
Intensity and polarization maps normalized to the continuum intensity of the quiet Sun, IQS. They show a bipolar region observed with CRISP in the Mg I b2 5173 Å line at 07:20 UT. Left: Intensity maps at different wavelengths. Right: Maps of Q and U averaged over three wavelengths in the blue wing (Δλ = −100, −50, and 0 mÅ), and a Stokes V magnetogram at ±50 mÅ from the core. The black arrow points toward the disk center. The red contours in the right panels delineate the boundaries of the pores.
Current usage metrics show cumulative count of Article Views (full-text article views including HTML views, PDF and ePub downloads, according to the available data) and Abstracts Views on Vision4Press platform.
Data correspond to usage on the plateform after 2015. The current usage metrics is available 48-96 hours after online publication and is updated daily on week days.
Initial download of the metrics may take a while.