Open Access
Fig. 6
Download original image
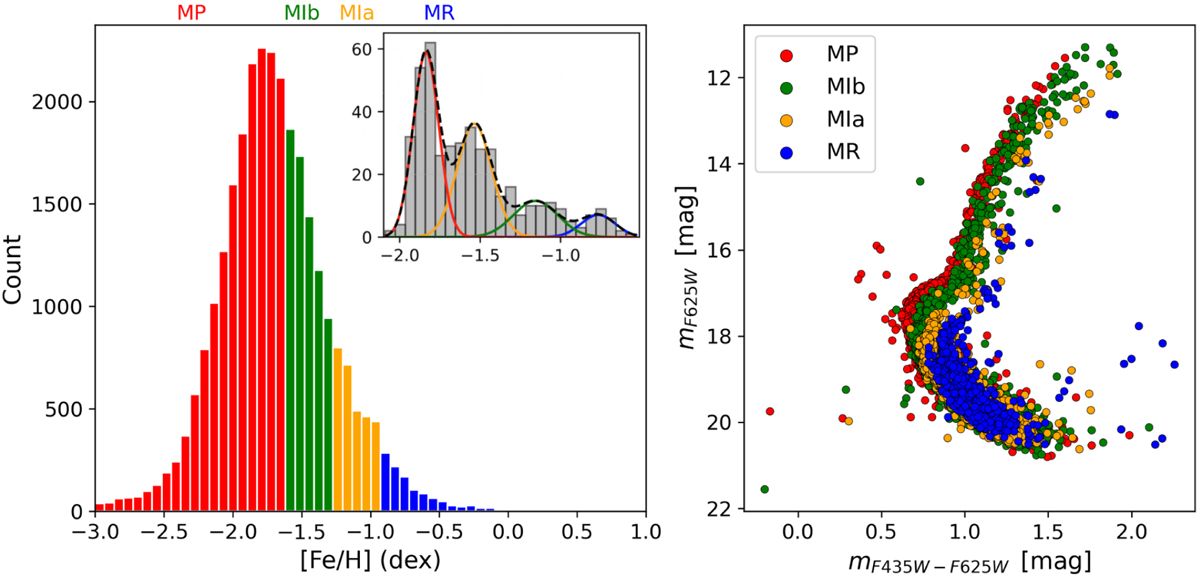
Left: metallicity distribution of our sample with the one from AG24 shown in the inserted panel. Different metallicity populations are represented by different colours. Right: CMD of different sub-populations.
Current usage metrics show cumulative count of Article Views (full-text article views including HTML views, PDF and ePub downloads, according to the available data) and Abstracts Views on Vision4Press platform.
Data correspond to usage on the plateform after 2015. The current usage metrics is available 48-96 hours after online publication and is updated daily on week days.
Initial download of the metrics may take a while.