Fig. 5
Download original image
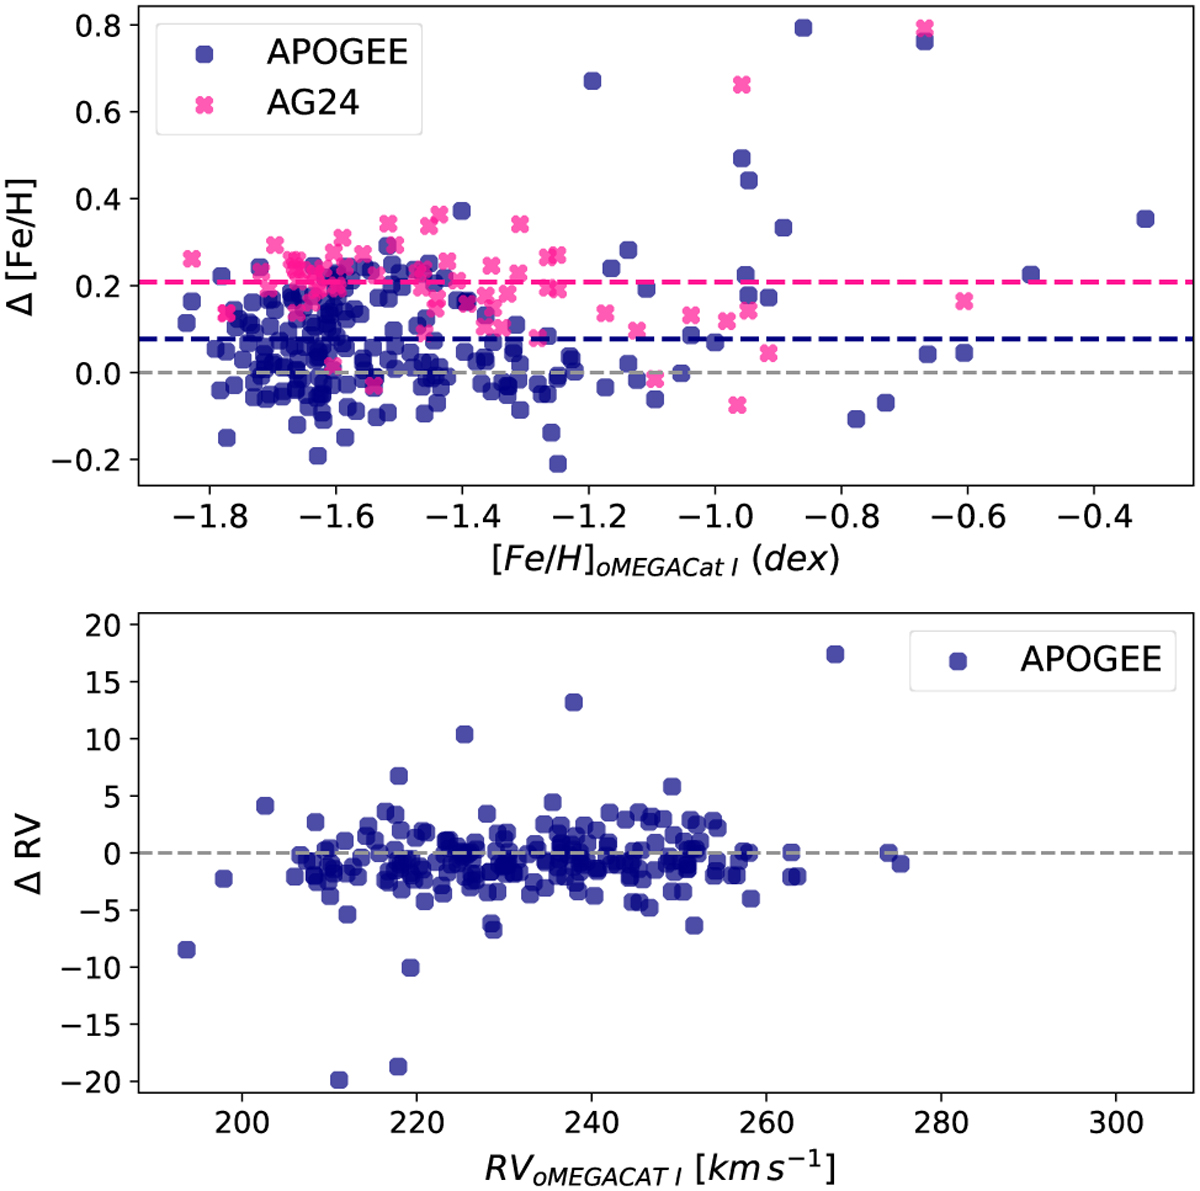
Top: comparison between metallicities of oMEGACat I catalogue with that from AG24 (pink cross) and APOGEE (purple circles). The purple and pink dashed line represents the mean offset of AG24 and APOGEE from oMEGACat I metallicities, respectively. Bottom: comparison of radial velocities between oMEGACat I and APOGEE. The y-axes of the top and bottom panels represent [Fe/H]oMEGACatI − [Fe/H]lit and RVoMEGACatI − RVlit, respectively.
Current usage metrics show cumulative count of Article Views (full-text article views including HTML views, PDF and ePub downloads, according to the available data) and Abstracts Views on Vision4Press platform.
Data correspond to usage on the plateform after 2015. The current usage metrics is available 48-96 hours after online publication and is updated daily on week days.
Initial download of the metrics may take a while.