Fig. 8.
Download original image
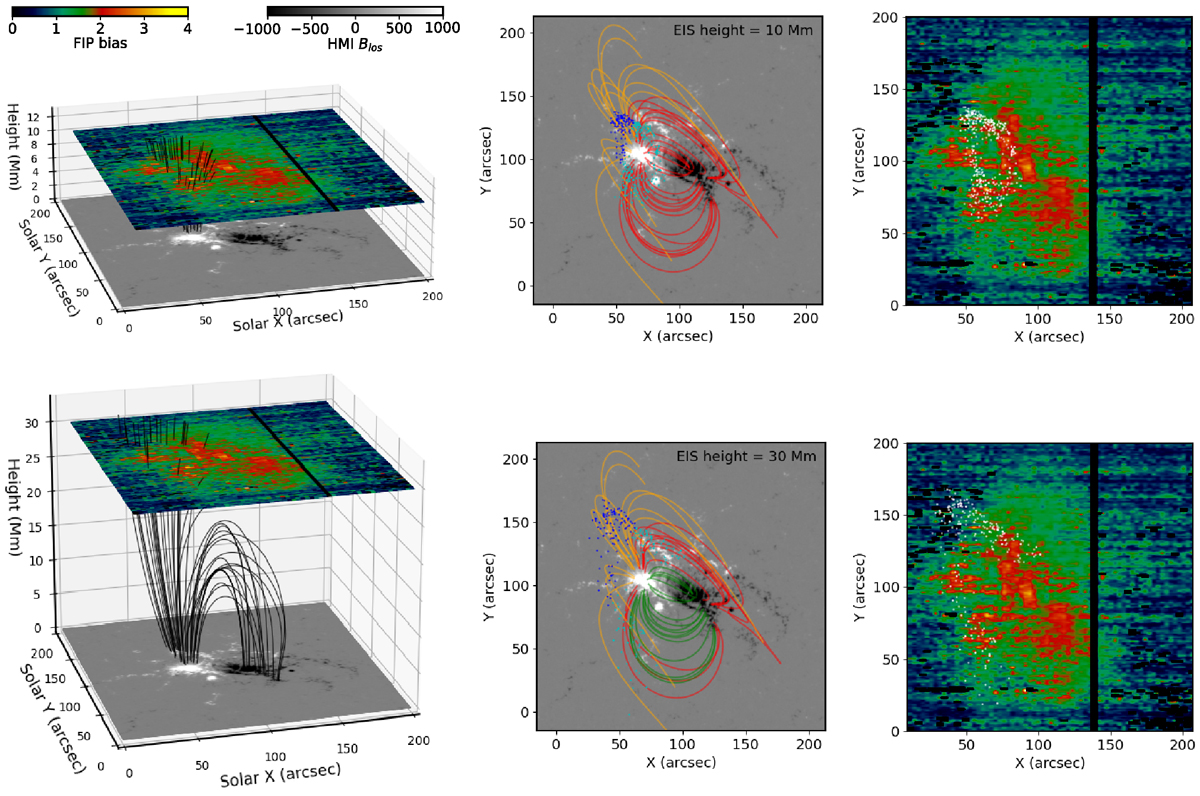
Left panels: 3D view of extrapolated magnetic fields from the HMI magnetogram using a linear force-free field model with α = −0.002. The fields connect to the EIS FIP bias map supposedly at heights of 10 Mm (top) and 30 Mm (bottom), respectively. The magnetic field lines originate from the wave packet locations in the chromosphere at an assumed height of 2 Mm. Middle panels: projected magnetic fields with yellow indicating open fields. Red and green lines represent closed field lines, with red indicating heights above the EIS FIP bias map and green below. Blue and cyan dots mark where the field lines connect to the EIS map for open and closed fields, respectively. Right panels: connected regions (white dots) projected onto the EIS FIP bias map at different heights.
Current usage metrics show cumulative count of Article Views (full-text article views including HTML views, PDF and ePub downloads, according to the available data) and Abstracts Views on Vision4Press platform.
Data correspond to usage on the plateform after 2015. The current usage metrics is available 48-96 hours after online publication and is updated daily on week days.
Initial download of the metrics may take a while.