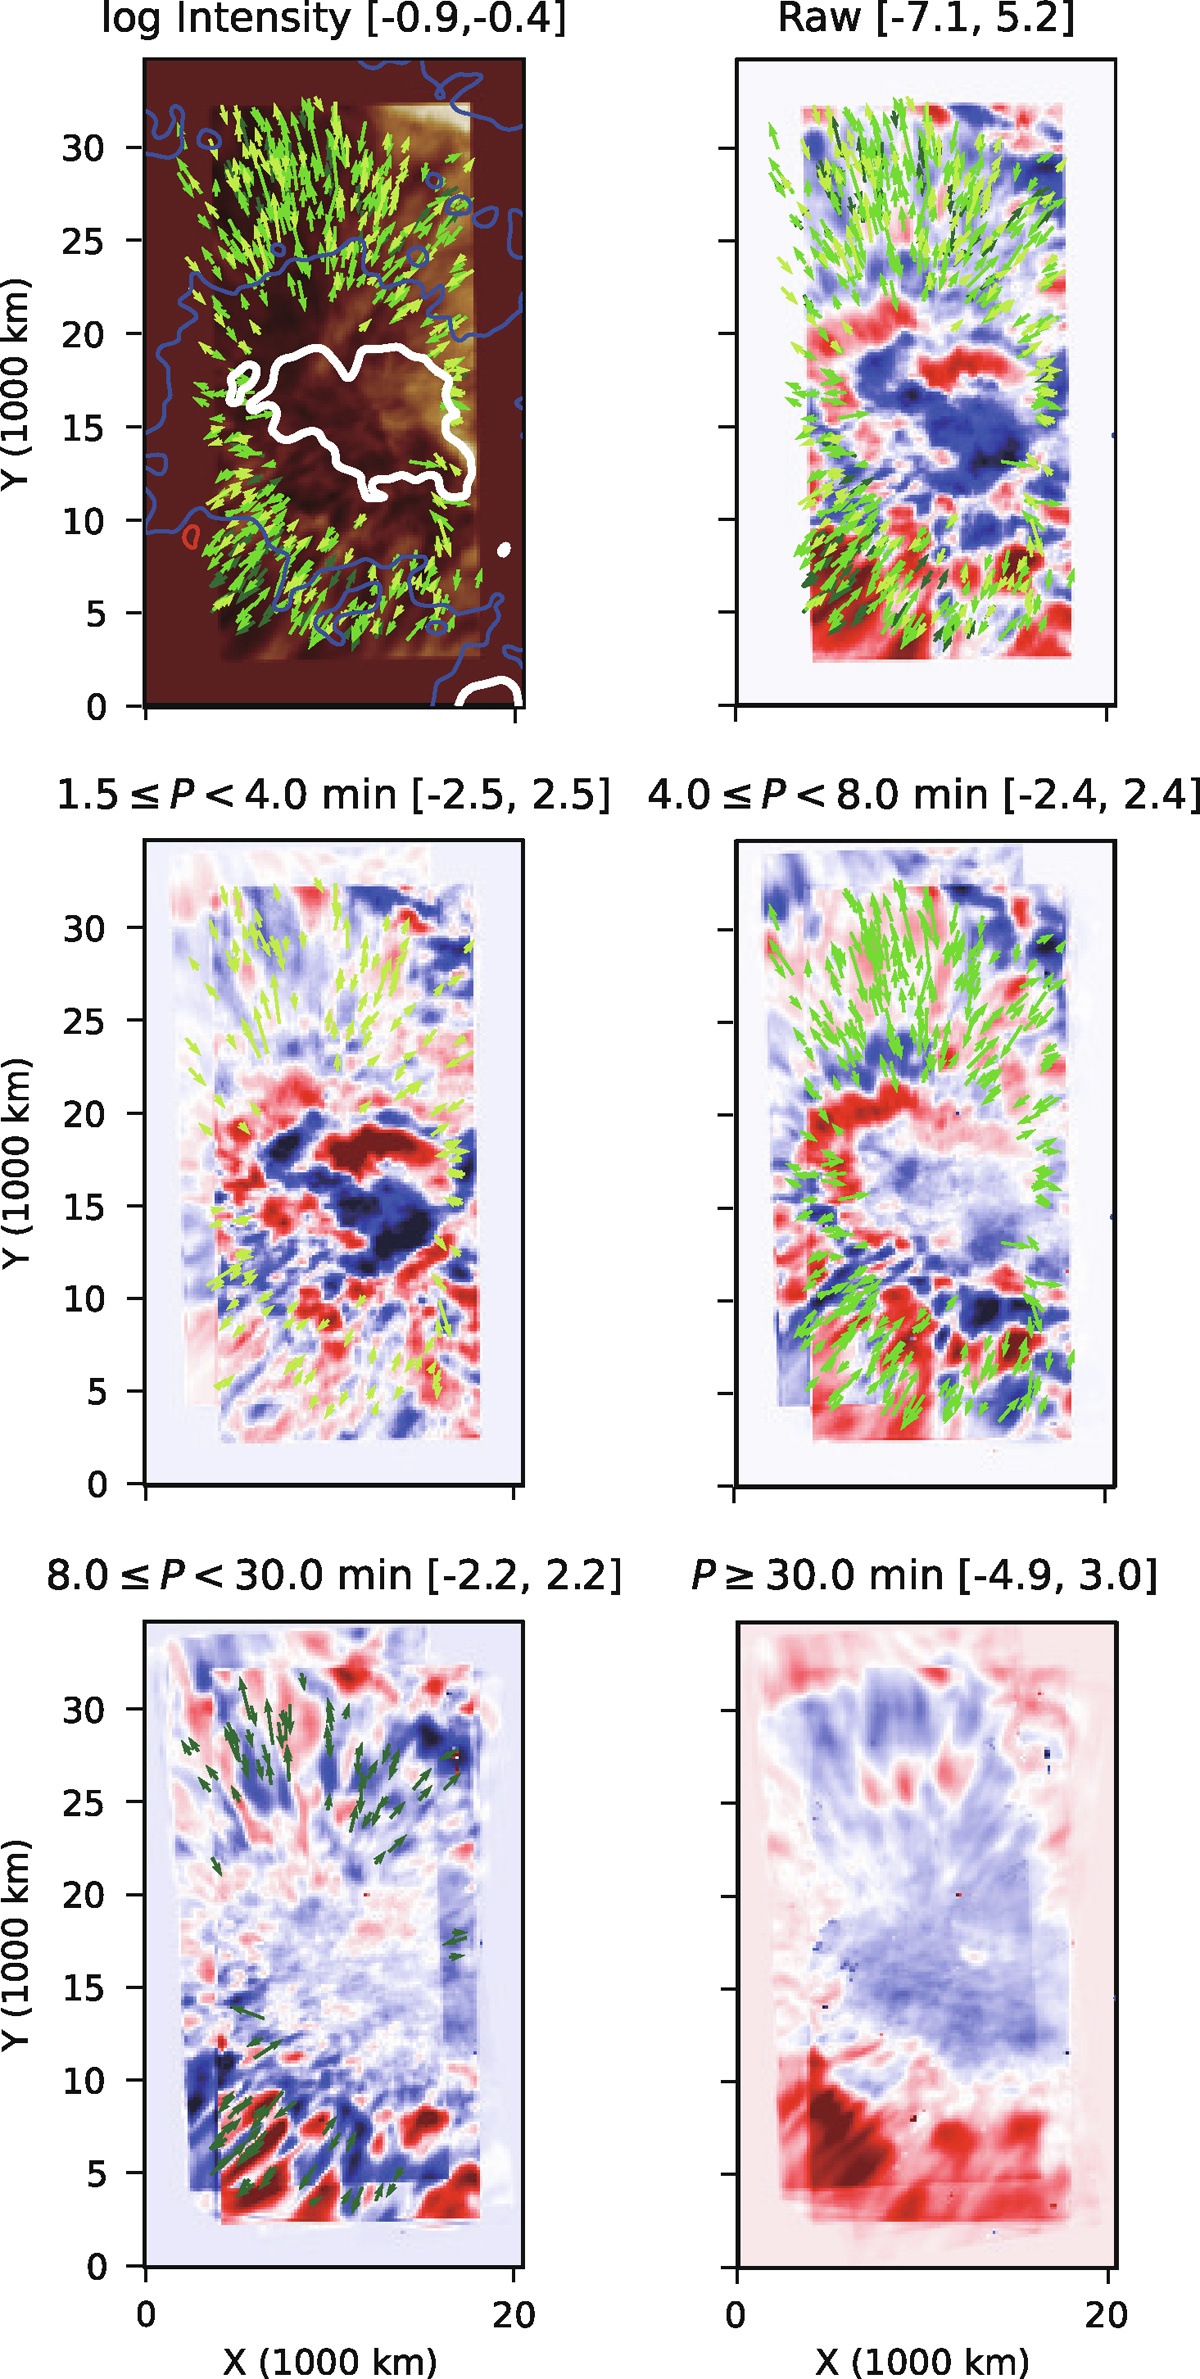
Fig. 7.
Download original image
Spatial distribution of the 412 detected wave packets during the FISS observing period, 20:11:55–21:59:03 UT. The top panels show the Hα intensity and chromospheric LOS velocity maps. The middle and bottom panels display the band-filtered velocity maps. The numeric values in the brackets of each map are the lower and upper bounds for byte-scale display. The arrows depict detected wave packets, with their centers located at the midpoint between two chosen points used for cross-correlation analysis. The direction of the arrows shows the wave propagation direction. The length of the arrows corresponds to the propagation speed, proportional to c1/3. The colors of the arrows distinguish the wave packets from one another based on different period bands: light green for 3-minute waves, medium green for 5-minute waves, and dark green for 10-minute waves. The white, blue, and red contours in the intensity map represent the 1000 Gauss, 150 Gauss, and −150 Gauss, respectively.
Current usage metrics show cumulative count of Article Views (full-text article views including HTML views, PDF and ePub downloads, according to the available data) and Abstracts Views on Vision4Press platform.
Data correspond to usage on the plateform after 2015. The current usage metrics is available 48-96 hours after online publication and is updated daily on week days.
Initial download of the metrics may take a while.