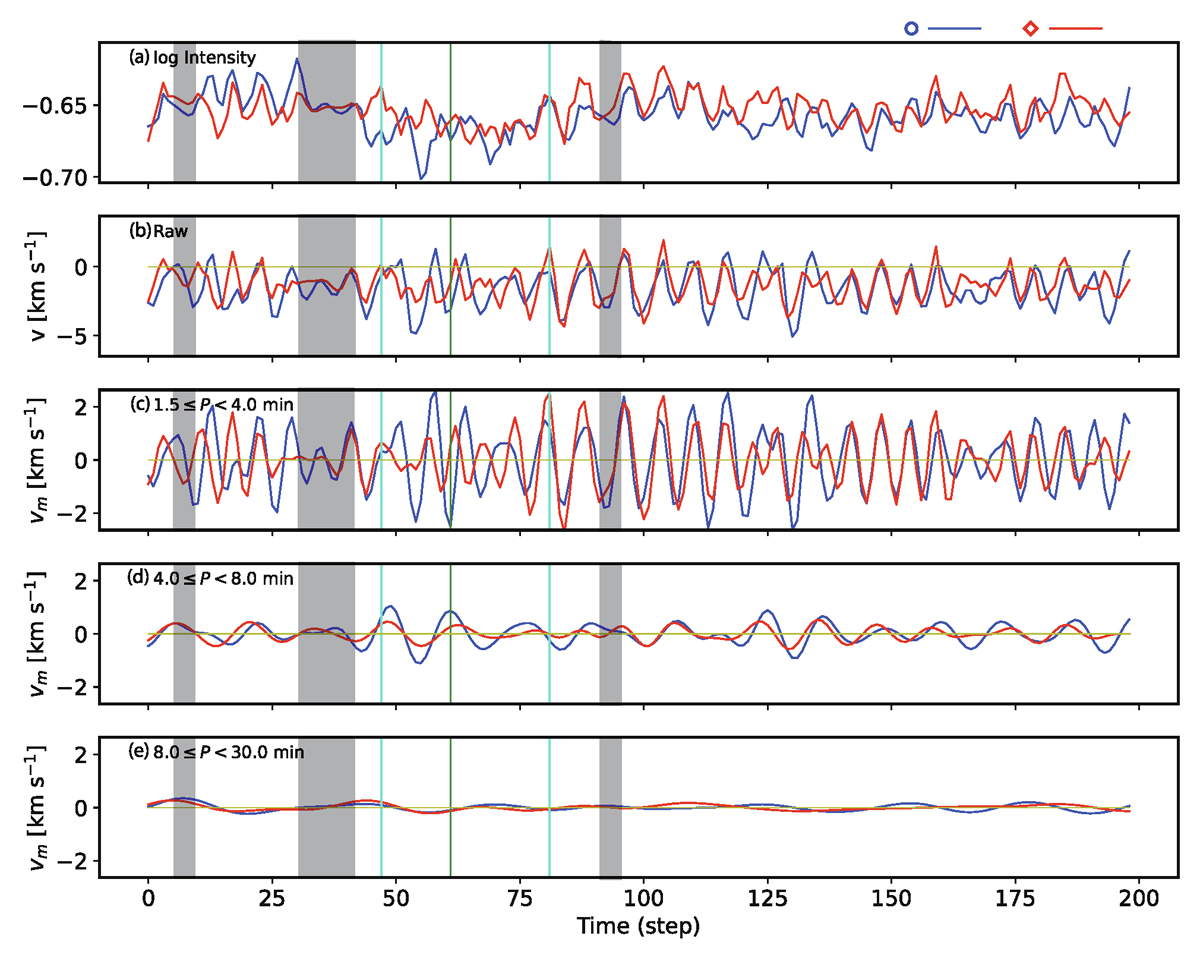
Fig. 5.
Download original image
Time variations in (a) Hα chromospheric intensity, (b) chromospheric LOS velocity, and (c–e) band-filtered LOS velocities at two points, ‘o’ and ‘♢’ in the umbra, as is marked in Fig. 4. The shaded gray regions correspond to the predicted data using an autoregressive model since data are missing. The vertical green line indicates the observing time of the maps presented in Fig. 4. The two vertical cyan lines indicate the start and end time for the correlation analysis.
Current usage metrics show cumulative count of Article Views (full-text article views including HTML views, PDF and ePub downloads, according to the available data) and Abstracts Views on Vision4Press platform.
Data correspond to usage on the plateform after 2015. The current usage metrics is available 48-96 hours after online publication and is updated daily on week days.
Initial download of the metrics may take a while.