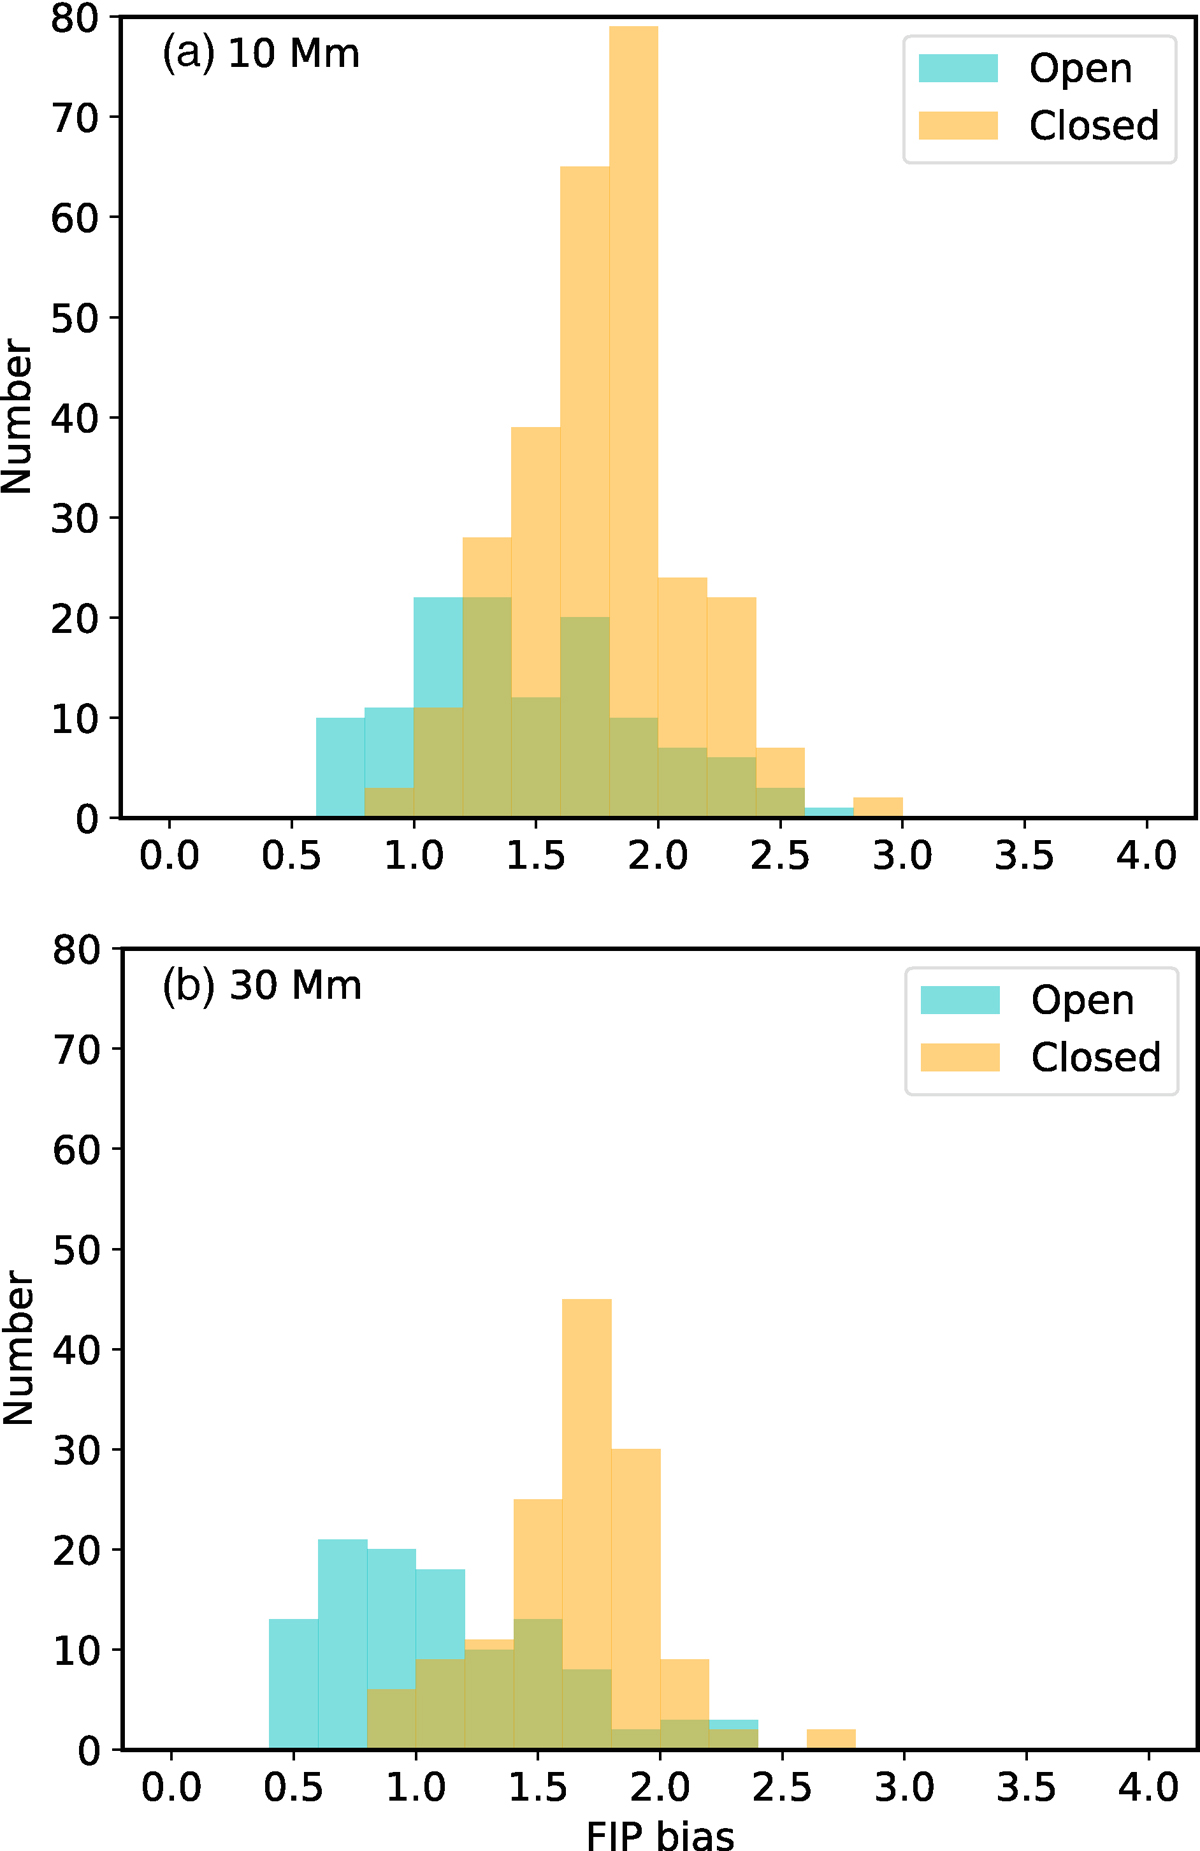
Fig. 10.
Download original image
Histograms of FIP bias values from regions linked to extrapolated magnetic fields originating from 412 chromospheric wave packets, at assumed coronal heights where FIP bias is observed: (a) 10 Mm and (b) 30 Mm. The distributions are based on 404 intersecting regions (open: 124, closed: 280) at 10 Mm and 250 regions (open: 111, closed: 139) at 30 Mm reflecting height-dependent connectivity. Blue represents regions connected through open fields, while yellow indicates those connected through closed fields.
Current usage metrics show cumulative count of Article Views (full-text article views including HTML views, PDF and ePub downloads, according to the available data) and Abstracts Views on Vision4Press platform.
Data correspond to usage on the plateform after 2015. The current usage metrics is available 48-96 hours after online publication and is updated daily on week days.
Initial download of the metrics may take a while.