Fig. 2.
Download original image
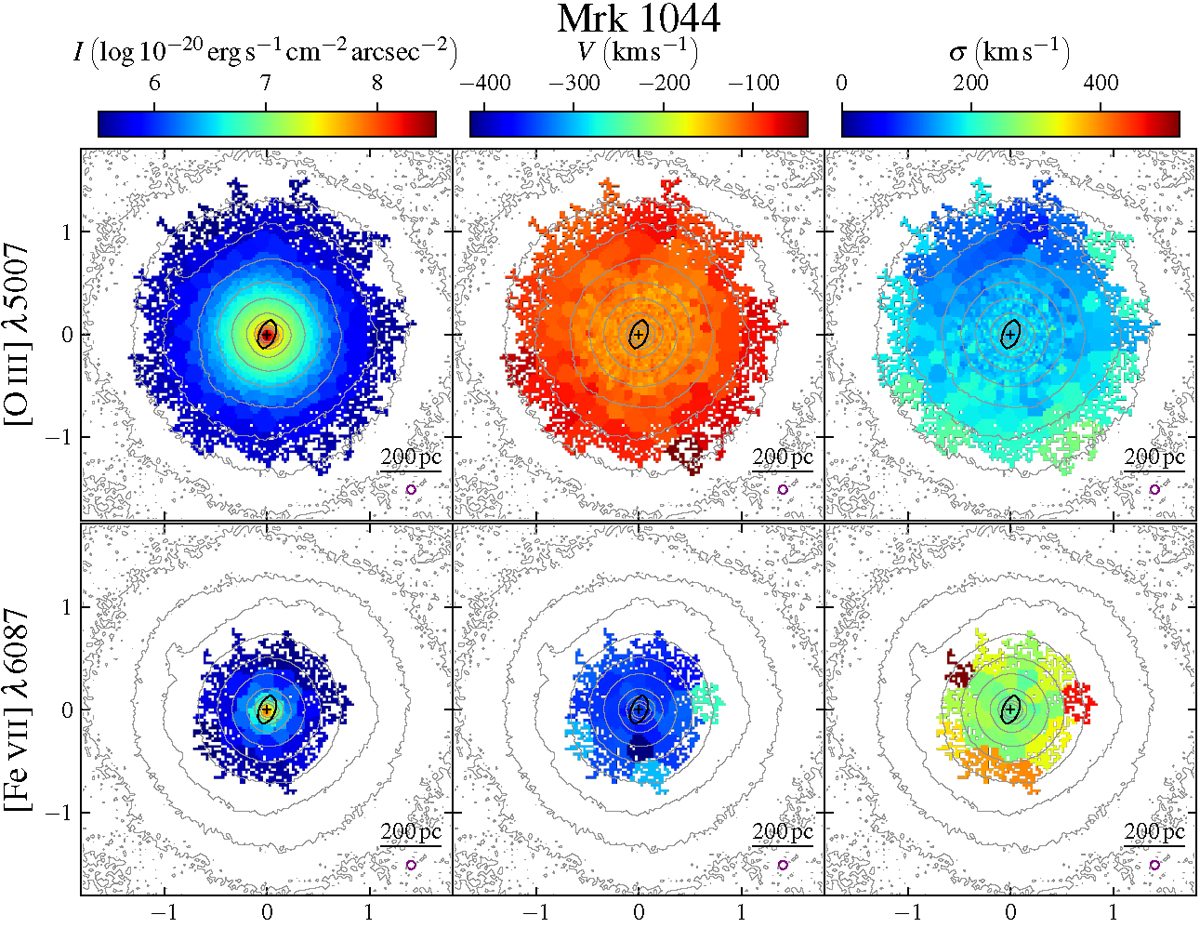
Maps of the surface brightness, Σ (left column), velocity, V (middle column), and velocity dispersion, σ (right column) measured for [O III] λ5007 (upper row) and [Fe VII] λ6087 (lower row), respectively. The grey contours indicate the stellar continuum estimated in the range between λ = 5250 Å and λ = 5450 Å in the rest frame of the galaxy. The black contours correspond to the unresolved 8.49 GHz radio emission from NVAS with a beam size of ![]() and a position angle of
and a position angle of ![]() . The separation between contours corresponds to factors of two in surface brightness. The purple circle indicates the FWHM of the MUSE data,
. The separation between contours corresponds to factors of two in surface brightness. The purple circle indicates the FWHM of the MUSE data, ![]() . The cross indicates the centre of the galaxy. The axes labels are in arcseconds. North is up and east is to the left.
. The cross indicates the centre of the galaxy. The axes labels are in arcseconds. North is up and east is to the left.
Current usage metrics show cumulative count of Article Views (full-text article views including HTML views, PDF and ePub downloads, according to the available data) and Abstracts Views on Vision4Press platform.
Data correspond to usage on the plateform after 2015. The current usage metrics is available 48-96 hours after online publication and is updated daily on week days.
Initial download of the metrics may take a while.