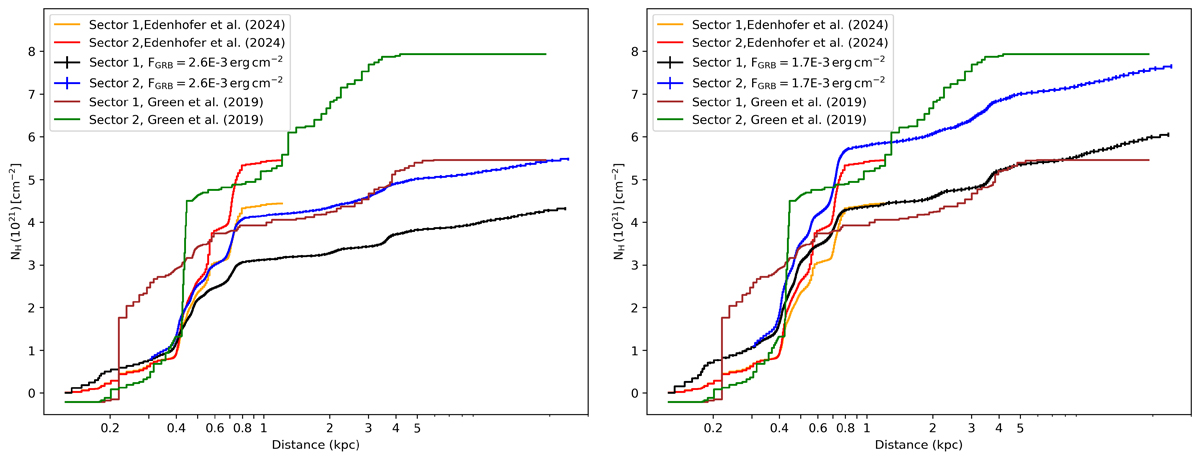
Fig. 7.
Download original image
Cumulative hydrogen column densities obtained from X-ray dust scattering for Sector 1 (black) and Sector 2 (blue), calculated using either the best-fit fluence from T23 (left panel) or a factor of 1.35 smaller fluence (right panel). In both cases, the same dust distribution for distances < 300 pc were assumed for the two sectors. Both panels also show a comparison with the cumulative hydrogen column density derived from Green et al. (2019, brown for Sector 1 and green for Sector 2) and from Edenhofer et al. (2024, orange for Sector 1 and red for Sector 2). A conversion factor between NH and Av equal to 1.9 × 1021 cm−2 mag−1 was used.
Current usage metrics show cumulative count of Article Views (full-text article views including HTML views, PDF and ePub downloads, according to the available data) and Abstracts Views on Vision4Press platform.
Data correspond to usage on the plateform after 2015. The current usage metrics is available 48-96 hours after online publication and is updated daily on week days.
Initial download of the metrics may take a while.