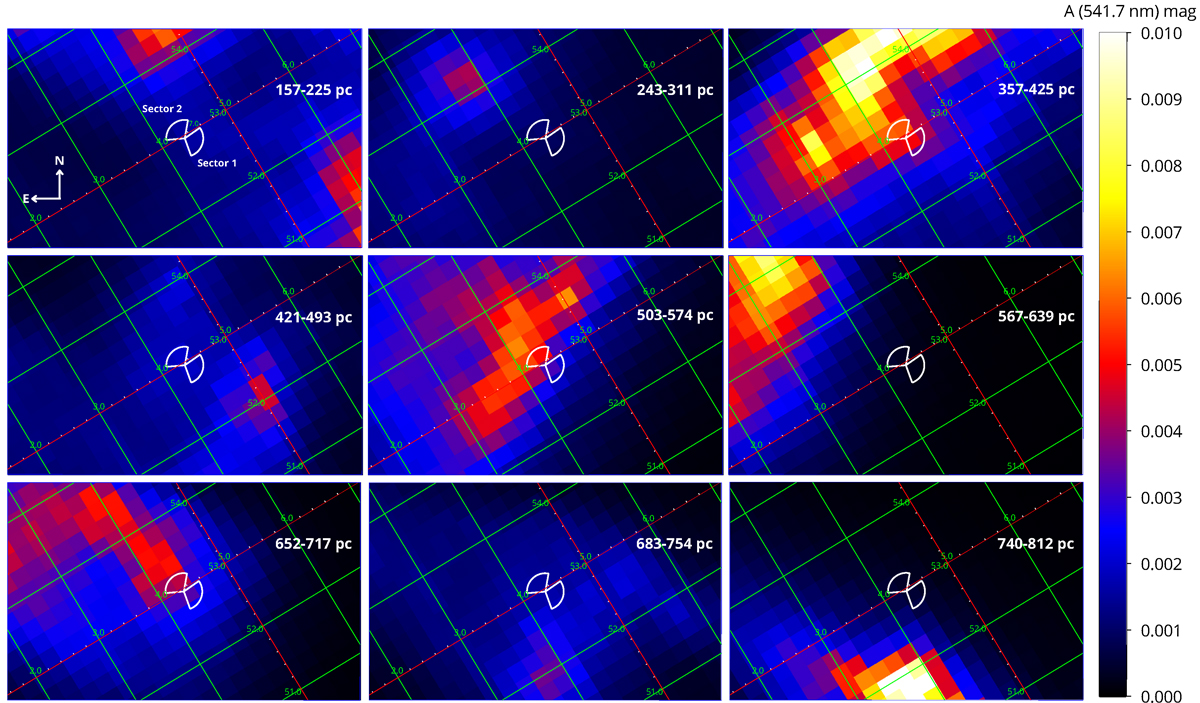
Fig. 6.
Download original image
Extinction maps at λ = 541.7 nm from Edenhofer et al. (2024) in the direction of GRB 221009A, integrated in the following distance intervals: 157–225 pc (top-left panel), 243–311 pc (top-central panel), 357–425 pc (top-right panel), 421–493 pc (center-left panel), 503–574 pc (central panel), 357-425 pc (center-right panel), 652–717 pc (bottom-left panel), 683–754 pc (bottom-central panel), and 740–812 pc (bottom-right panel). The regions covered by the two sectors studied in this work are highlighted in white in each panel. The green grid indicates the Galactic coordinates in degrees.
Current usage metrics show cumulative count of Article Views (full-text article views including HTML views, PDF and ePub downloads, according to the available data) and Abstracts Views on Vision4Press platform.
Data correspond to usage on the plateform after 2015. The current usage metrics is available 48-96 hours after online publication and is updated daily on week days.
Initial download of the metrics may take a while.