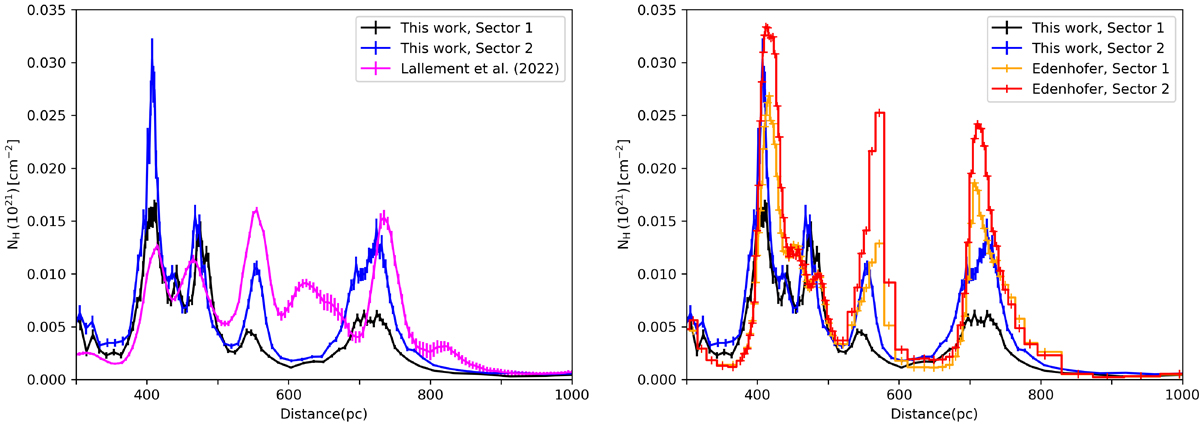
Fig. 5.
Download original image
Differential hydrogen column density derived from X-ray dust scattering for Sector 1 (black) and Sector 2 (blue), compared to 3D optical extinction maps. Left: Values derived by Lallement et al. (2022), displayed in pink. Right: Differential hydrogen column density from Edenhofer et al. (2024) for Sector 1 (in orange) and Sector 2 (in red). A conversion factor of 1.9 × 1021 cm−2 mag−1 between NH and Av was used.
Current usage metrics show cumulative count of Article Views (full-text article views including HTML views, PDF and ePub downloads, according to the available data) and Abstracts Views on Vision4Press platform.
Data correspond to usage on the plateform after 2015. The current usage metrics is available 48-96 hours after online publication and is updated daily on week days.
Initial download of the metrics may take a while.