Fig. 4.
Download original image
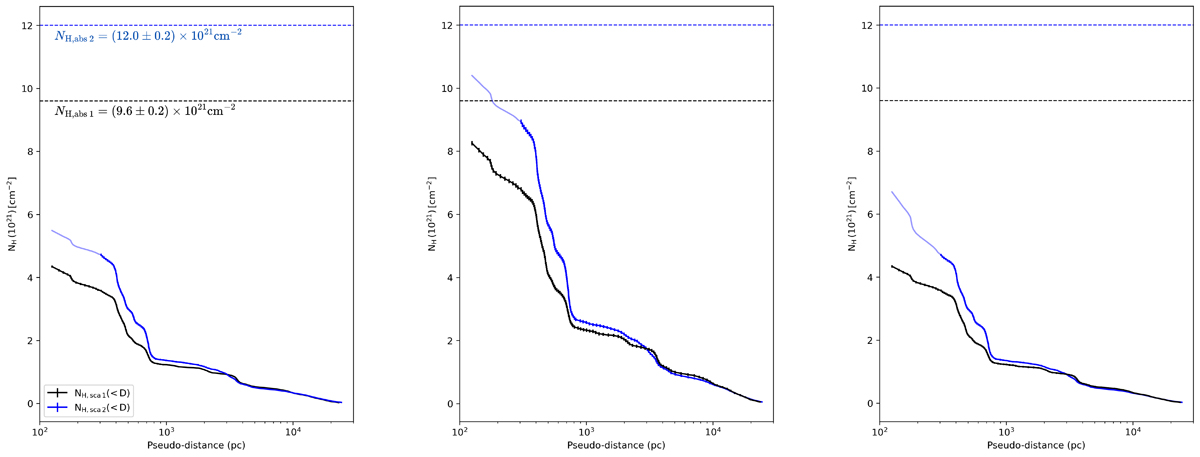
Cumulative hydrogen column density in our Galaxy for Sector 1 (solid black lines) and Sector 2 (solid blue lines) derived from ring emission under different assumptions: GRB fluence from T23 (left panel); 1.9 times lower fluence than in T23 (middle panel); GRB fluence from T23 and 2.6 times more dust in Sector 2 than in Sector 1 within 300 pc (right panel). In the first two panels, the same dust concentration is assumed for both sectors at distances < 300 pc. The dashed lines (black for Sector 1, blue for Sector 2) indicate the total hydrogen column density, including contributions from both our Galaxy and the host galaxy, measured from the absorption inferred from X-ray spectral fitting.
Current usage metrics show cumulative count of Article Views (full-text article views including HTML views, PDF and ePub downloads, according to the available data) and Abstracts Views on Vision4Press platform.
Data correspond to usage on the plateform after 2015. The current usage metrics is available 48-96 hours after online publication and is updated daily on week days.
Initial download of the metrics may take a while.