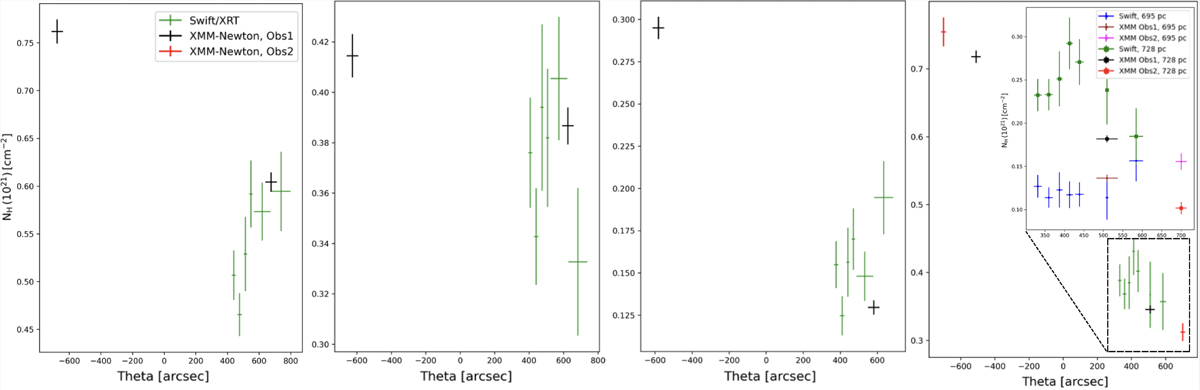
Fig. 3.
Download original image
Hydrogen column density obtained by integrating the pseudo-distance distribution at the four main peaks in Fig. 2 (highlighted with blue arrows), centered at 406.3 pc (leftmost panel), 475.2 pc (center-left panel), 553.6 pc (center-right panel), and ∼700 pc (rightmost panel). The inset of the last panel shows the two clouds around 700 pc as separate values: the circles refer to the peak at 695.4 pc (Swift-XRT in blue, XMM-Newton in brown for Obs1, and pink for Obs2), and the squares to the peak centered at 728.6 pc (Swift-XRT in green, XMM-Newton in black for Obs1, and red for Obs2). In all the other panels the values from Swift-XRT observations are shown in green, and from XMM-Newton observations in black (Obs1) and red (Obs2).
Current usage metrics show cumulative count of Article Views (full-text article views including HTML views, PDF and ePub downloads, according to the available data) and Abstracts Views on Vision4Press platform.
Data correspond to usage on the plateform after 2015. The current usage metrics is available 48-96 hours after online publication and is updated daily on week days.
Initial download of the metrics may take a while.