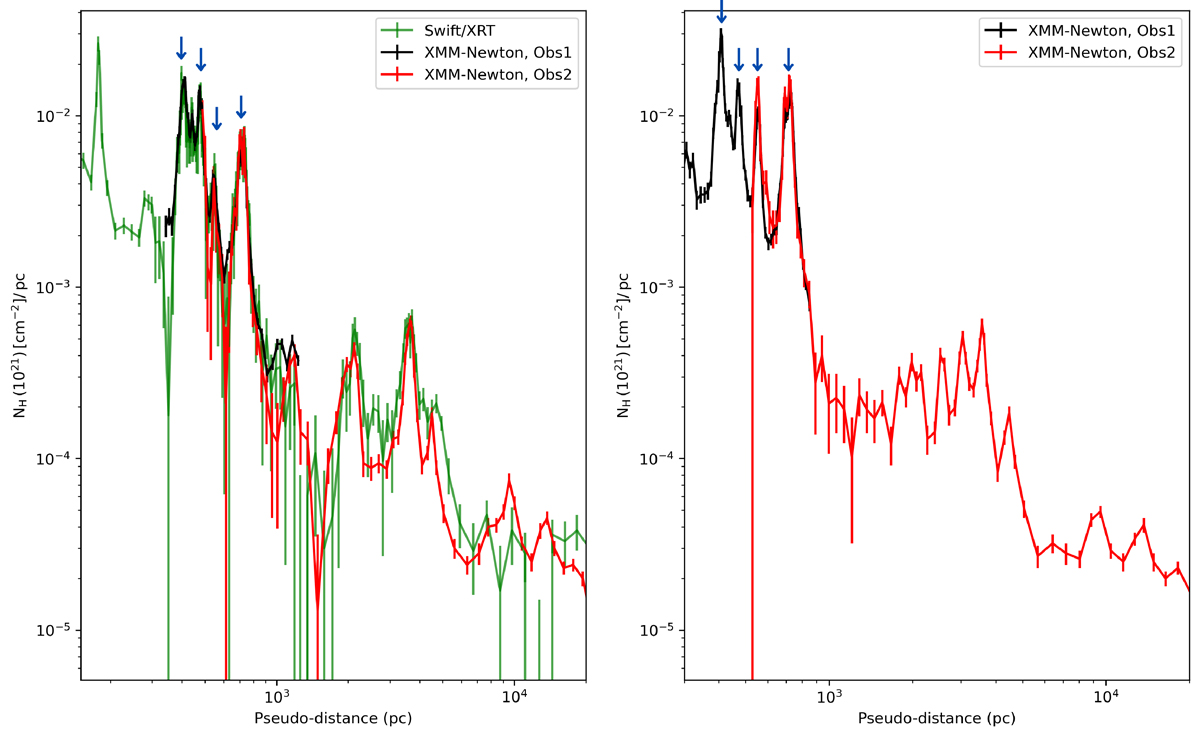
Fig. 2.
Download original image
Left: differential hydrogen column density in Sector 1. The Swift-XRT data are in green, the data obtained with the first XMM-Newton observation in black, and the data obtained with the second XMM-Newton observation in red. Right: Differential hydrogen column density in Sector 2. The data obtained with the first XMM-Newton observation are in black, and the data obtained with the second XMM-Newton observation in red. The blue arrows highlight the four main peaks observed by both XMM-Newton and Swift.
Current usage metrics show cumulative count of Article Views (full-text article views including HTML views, PDF and ePub downloads, according to the available data) and Abstracts Views on Vision4Press platform.
Data correspond to usage on the plateform after 2015. The current usage metrics is available 48-96 hours after online publication and is updated daily on week days.
Initial download of the metrics may take a while.