Fig. 4.
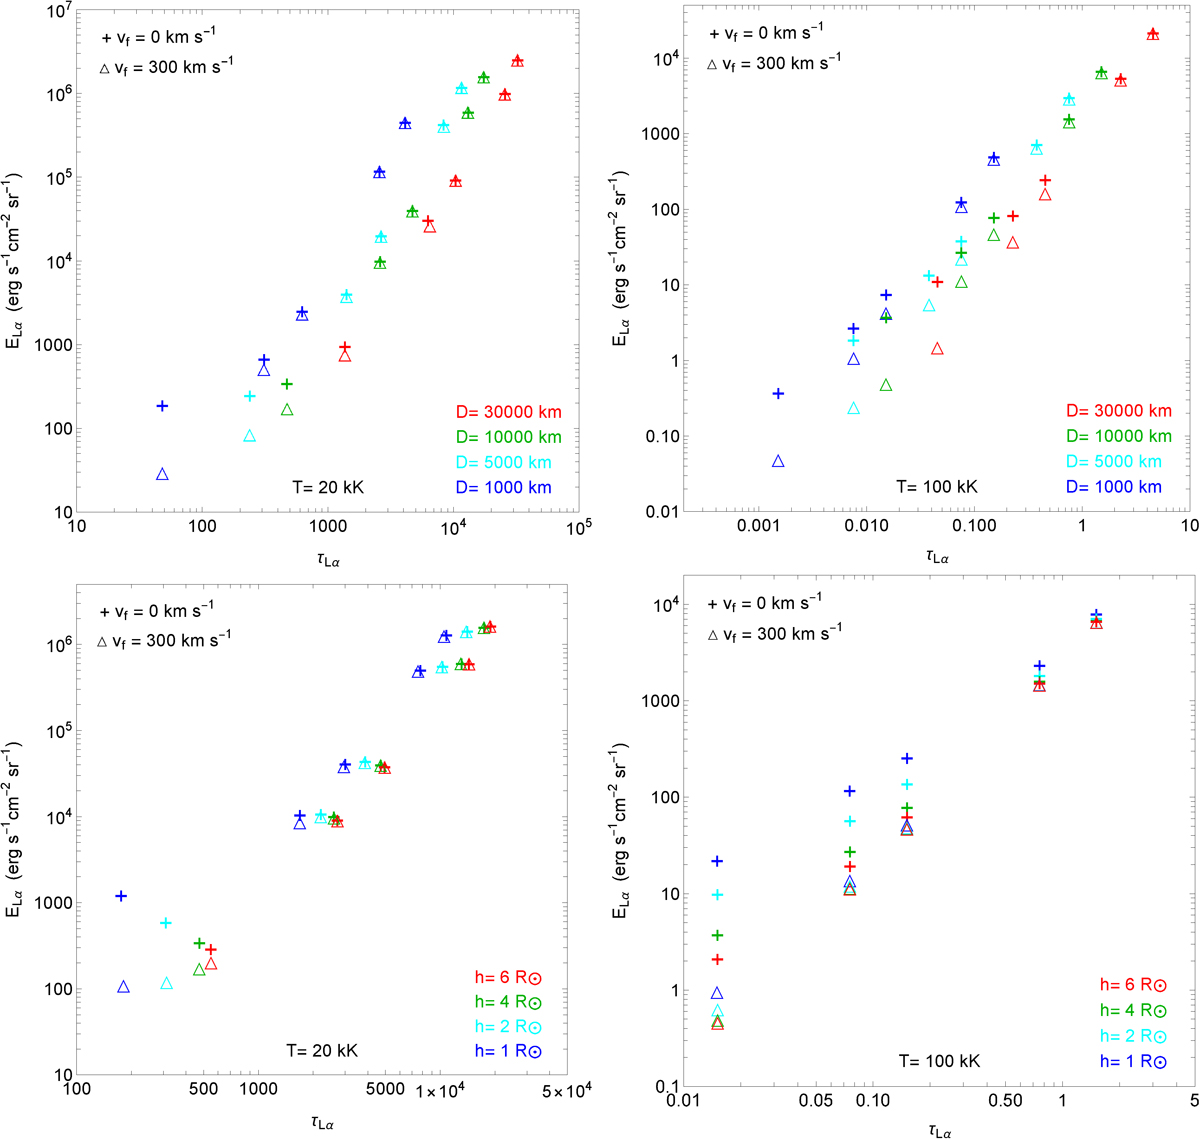
Download original image
Same plot as in Fig. 3, but for two representative flow velocities 0 and 300 km s−1, indicated by the symbols. Left panels show the results at a temperature of 20 kK and right panels at 100 kK. The upper panels show the same plot for the effective thickness dependence for a given height of 4 R⊙. Different thicknesses are indicated by different colors. The lower panels show the height dependence at a given thickness of 10 000 km. Different heights are indicated by the colors.
Current usage metrics show cumulative count of Article Views (full-text article views including HTML views, PDF and ePub downloads, according to the available data) and Abstracts Views on Vision4Press platform.
Data correspond to usage on the plateform after 2015. The current usage metrics is available 48-96 hours after online publication and is updated daily on week days.
Initial download of the metrics may take a while.