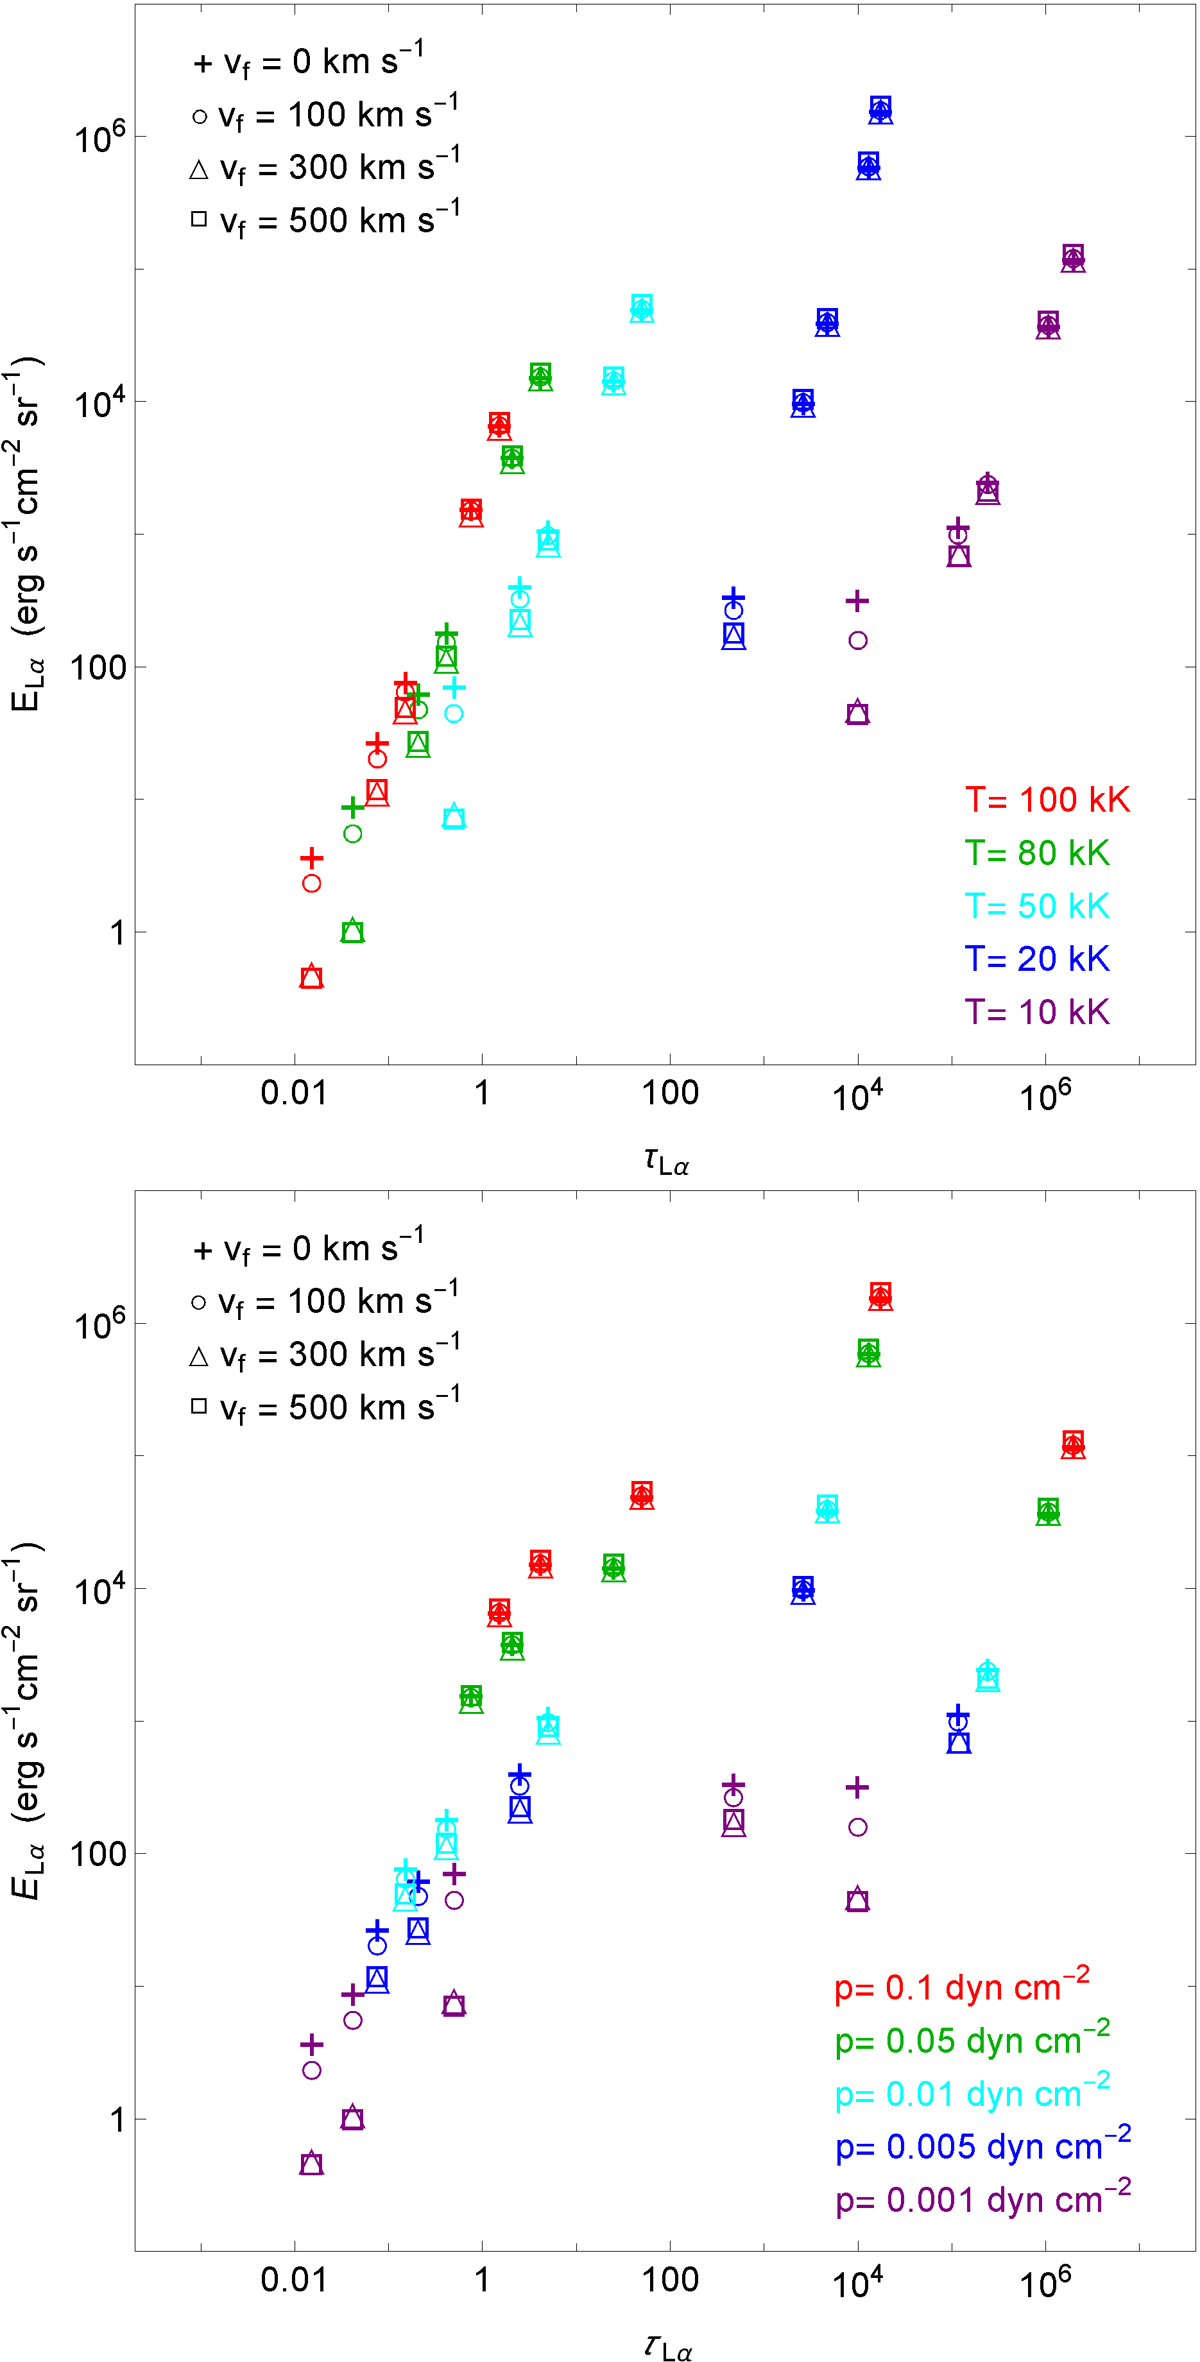
Fig. 3.
Download original image
Integrated intensity of the Lα line as function of the line-center optical thickness for a given height (4 R⊙) and thickness (10 000 km). Different flow velocities are indicated by symbols. Upper panel: Same, but for different temperatures (marked in color). Lower panel: Same, but for different gas pressures (marked in color).
Current usage metrics show cumulative count of Article Views (full-text article views including HTML views, PDF and ePub downloads, according to the available data) and Abstracts Views on Vision4Press platform.
Data correspond to usage on the plateform after 2015. The current usage metrics is available 48-96 hours after online publication and is updated daily on week days.
Initial download of the metrics may take a while.