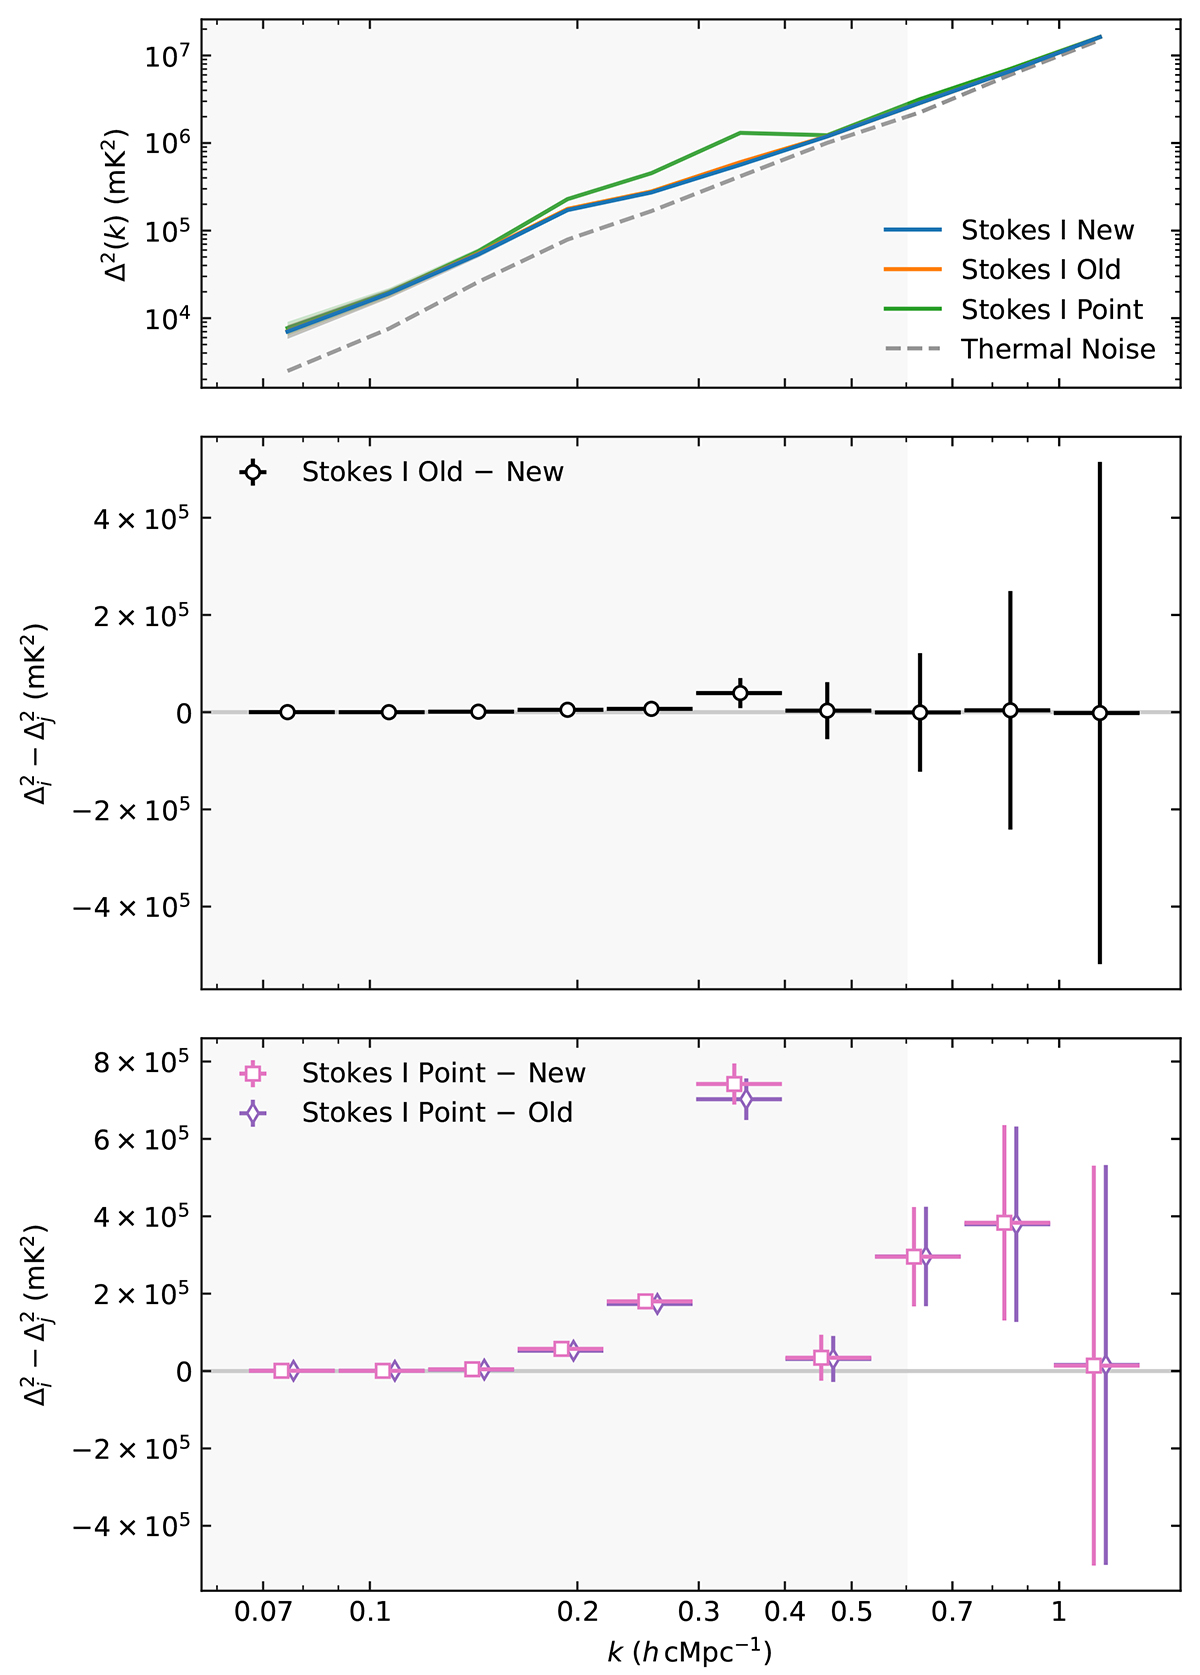
Fig. 9.
Download original image
Spherical power spectra after DD subtraction (top panel) and their difference (middle and bottom panels) for the simulated NCP dataset. The top panel shows Stokes IΔ2(k) after the DD subtraction step using the new (blue), old (orange), and point source (green) Cyg A model, and the thermal noise level (dashed grey line). The shaded areas represent the 1σ uncertainties. The middle panel shows the difference Δold2 − Δnew2 (black dots), while the bottom panel shows the differences Δpoint2 − Δnew2 (pink squares), and Δpoint2 − Δold2 (purple diamonds), with the associated 1σ uncertainties (values reported in Table D.1). The horizontal error bars indicate the k-bin extension. We added a small offset in k to the pink and purple markers in the bottom panel to avoid overlapping of error bars. The grey shaded area delimits the range in k where Δ2 upper limits are usually extracted from LOFAR data, being the most sensitive range for LOFAR.
Current usage metrics show cumulative count of Article Views (full-text article views including HTML views, PDF and ePub downloads, according to the available data) and Abstracts Views on Vision4Press platform.
Data correspond to usage on the plateform after 2015. The current usage metrics is available 48-96 hours after online publication and is updated daily on week days.
Initial download of the metrics may take a while.