Fig. 12.
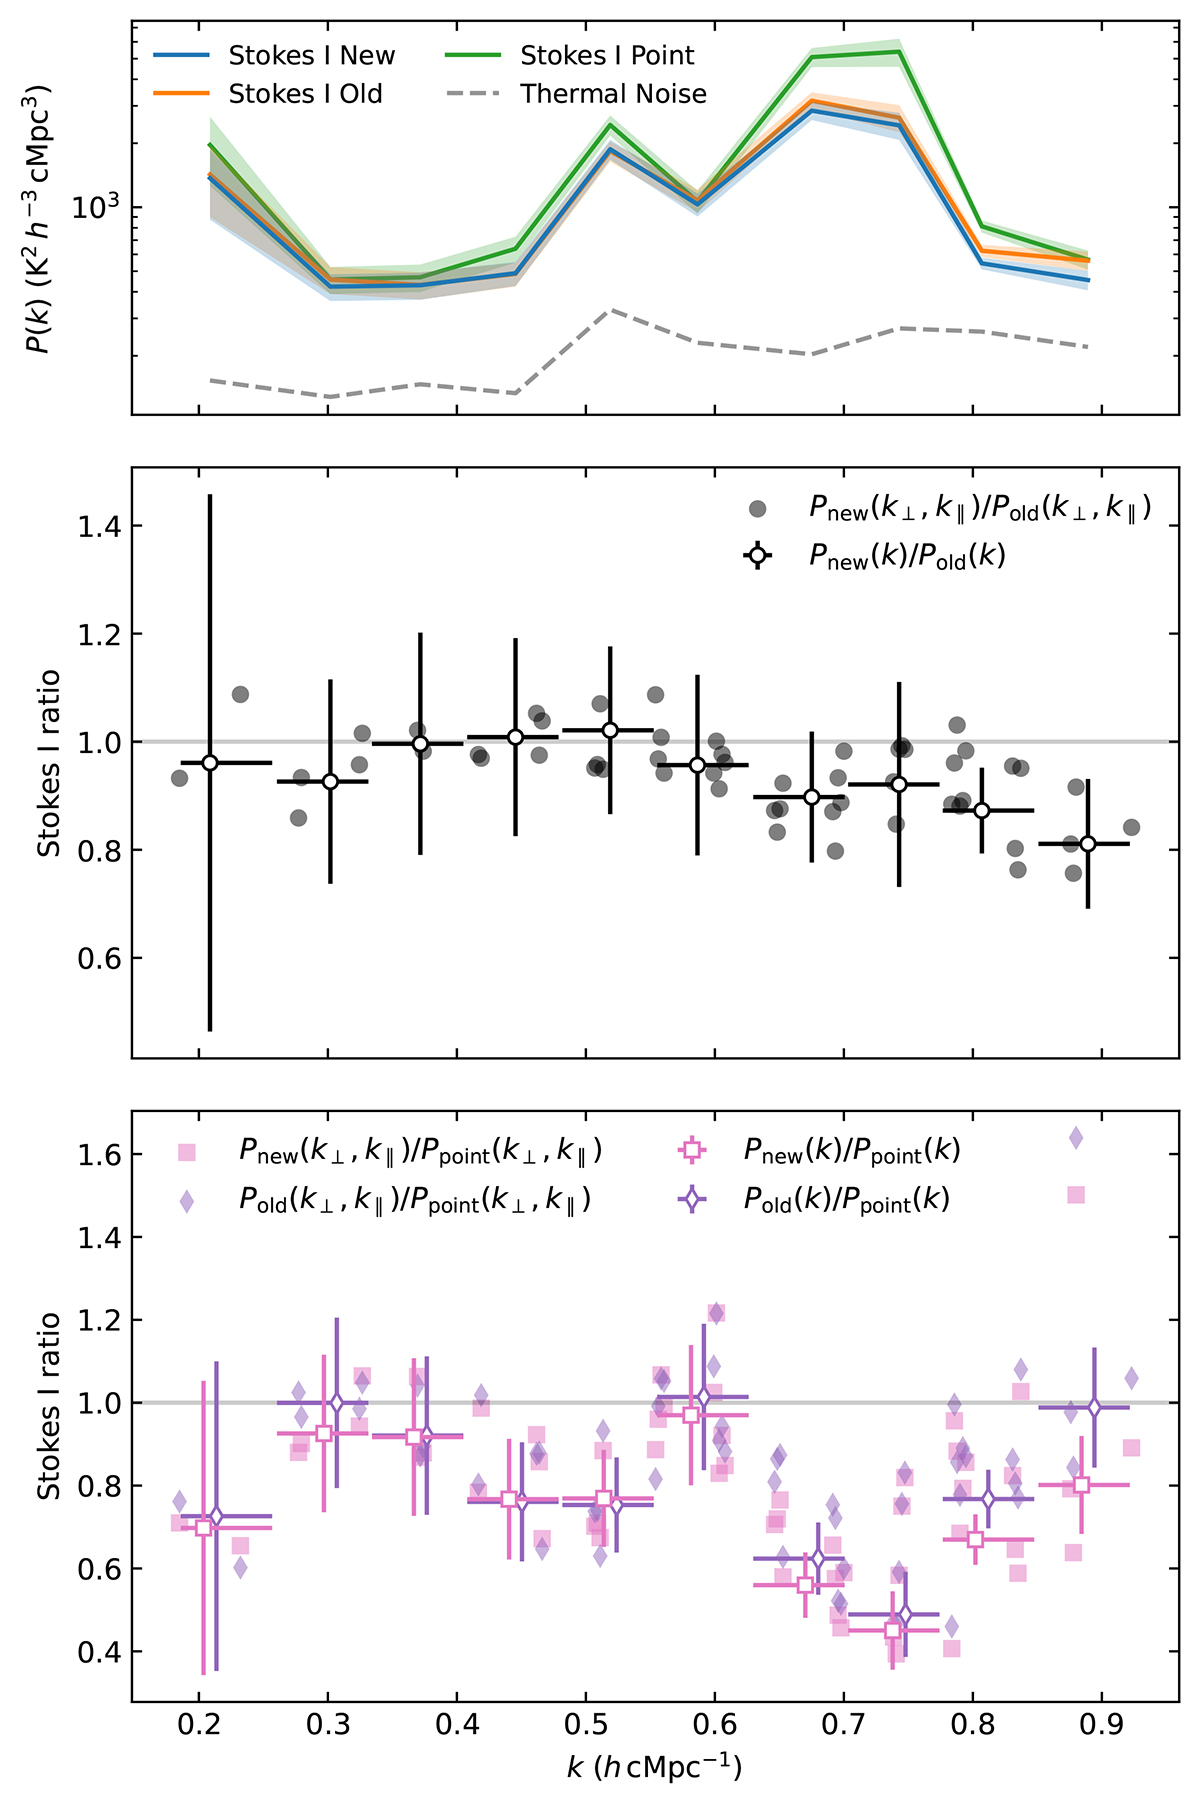
Download original image
Power spectra along the Cyg A direction after DD subtraction (top panel) and their ratios (middle and bottom panels) for the real observed NCP dataset. The top panel shows Stokes IP(k) after the DD subtraction step using the new (blue), old (orange), and point source (green) models, along with the thermal noise level (dashed grey line). The shaded areas represent the 1σ uncertainties. The middle panel shows the ratio New/Old (black points), while the bottom panel shows the ratios New/Point (pink squares), and Old/Point (purple diamonds). Filled markers represent the ratio of the cylindrical power spectra P(k⊥, k∥) for each (k⊥, k∥)-cell within the Cyg A delay lines, while the white-faced markers indicate the ratios of the power spectra P(k). For the latter, the horizontal error bars indicate the k-bin extension, while the vertical error bars indicate the 1σ uncertainties of the ratio. A small offset in k has been added to the white-faced pink squares and purple diamonds in the bottom panel to avoid overlapping of error bars.
Current usage metrics show cumulative count of Article Views (full-text article views including HTML views, PDF and ePub downloads, according to the available data) and Abstracts Views on Vision4Press platform.
Data correspond to usage on the plateform after 2015. The current usage metrics is available 48-96 hours after online publication and is updated daily on week days.
Initial download of the metrics may take a while.