Fig. 10.
Download original image
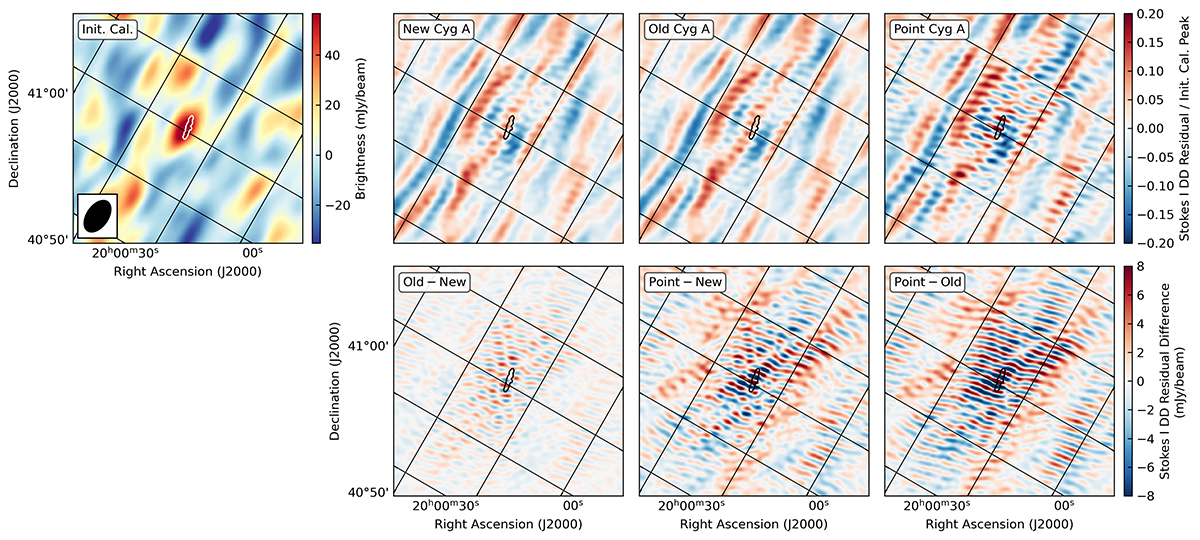
Dirty images of the real observed NCP dataset in the direction of Cyg A. The top row shows, from left to right: (i) the image after initial calibration, and residual images after DD subtraction using the (ii) new, (iii) old and (iv) point source model, divided by the peak brightness of the initially calibrated image. The bottom row shows the differences between residual images obtained after DD subtraction for the three Cyg A models: Old − New (left), Point − New (middle), and Point − Old (right). All the images have been obtained with a natural weighting scheme and using a baseline range of 50 − 4500λ, resulting in the synthesised beam shown in the bottom-left corner of the top-left panel. The contour in every panel is the 1 Jy/beam level from Fig. 1 to show the position and extension of Cyg A.
Current usage metrics show cumulative count of Article Views (full-text article views including HTML views, PDF and ePub downloads, according to the available data) and Abstracts Views on Vision4Press platform.
Data correspond to usage on the plateform after 2015. The current usage metrics is available 48-96 hours after online publication and is updated daily on week days.
Initial download of the metrics may take a while.