Open Access
Fig. 2.
Download original image
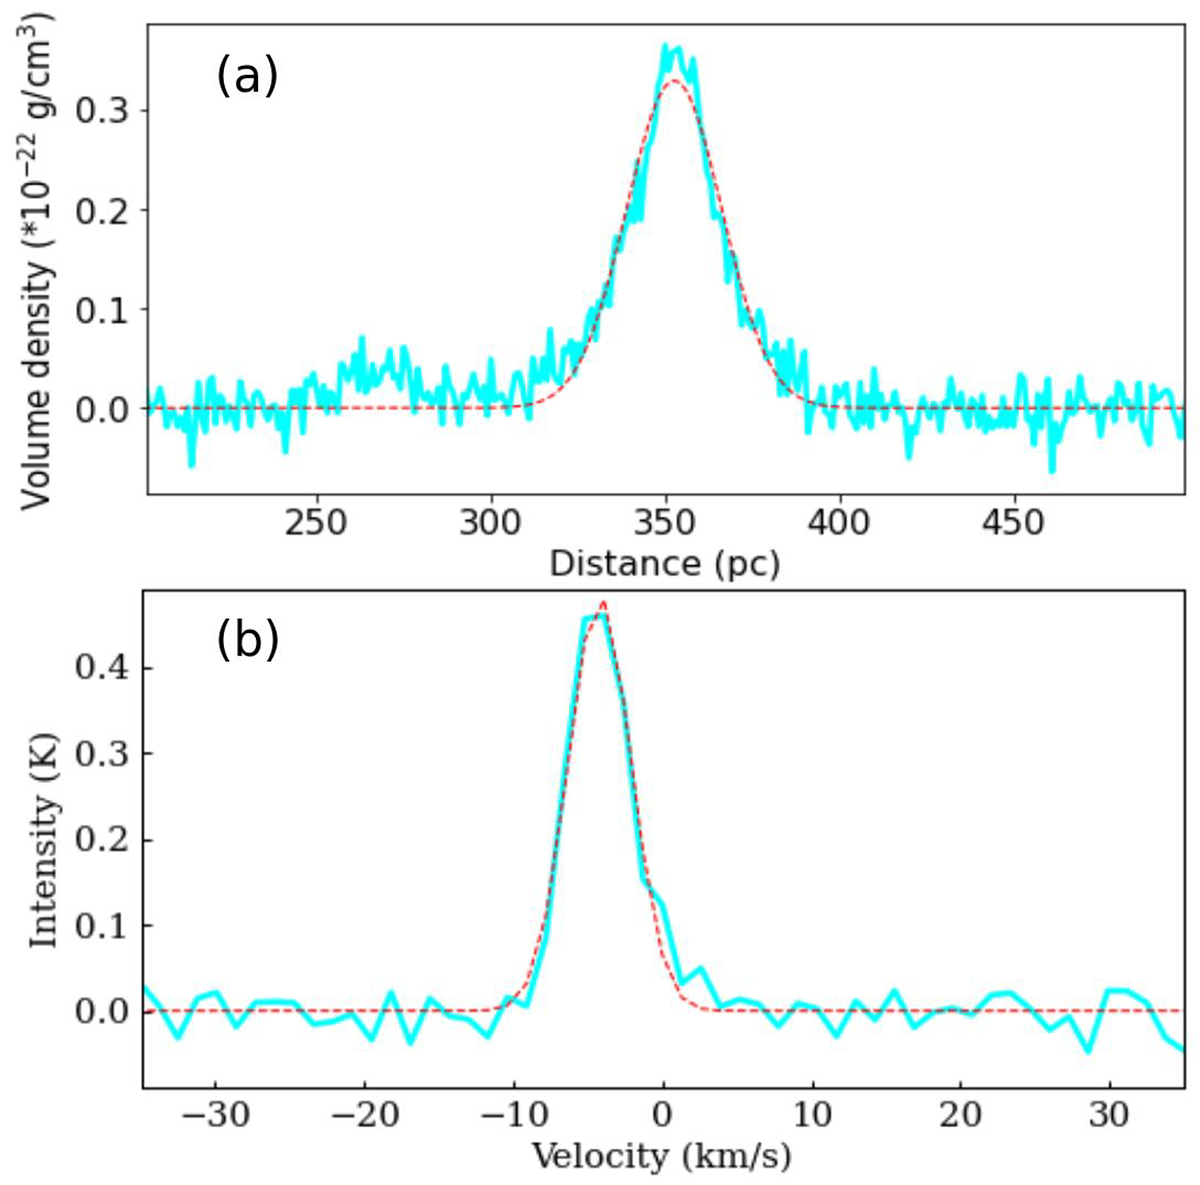
Average “spectra” (cyan lines) of a single structure extracted from the l − b − v and l − b − d cubes, respectively. (a) Averaged intensity distribution along the velocity axis. (b) Averaged density distribution along the distance axis. Red dashed lines represent the Gaussian fitting.
Current usage metrics show cumulative count of Article Views (full-text article views including HTML views, PDF and ePub downloads, according to the available data) and Abstracts Views on Vision4Press platform.
Data correspond to usage on the plateform after 2015. The current usage metrics is available 48-96 hours after online publication and is updated daily on week days.
Initial download of the metrics may take a while.