Open Access
Fig. 1.
Download original image
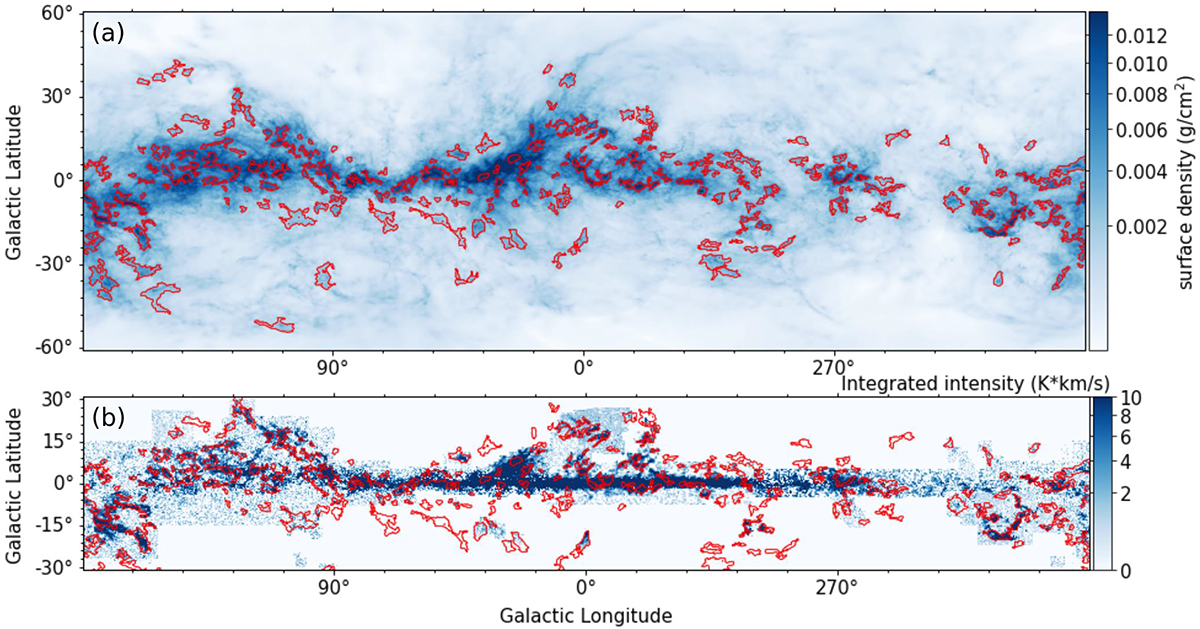
Structural identification. (a) Surface density of hydrogen nuclei on the l − b plane. Red contours are the structures identified by the dendrogram algorithm. (b) Integrated intensity map of CO (1−0) line emission. Red contours are the same as in panel (a).
Current usage metrics show cumulative count of Article Views (full-text article views including HTML views, PDF and ePub downloads, according to the available data) and Abstracts Views on Vision4Press platform.
Data correspond to usage on the plateform after 2015. The current usage metrics is available 48-96 hours after online publication and is updated daily on week days.
Initial download of the metrics may take a while.