Fig. 6
Download original image
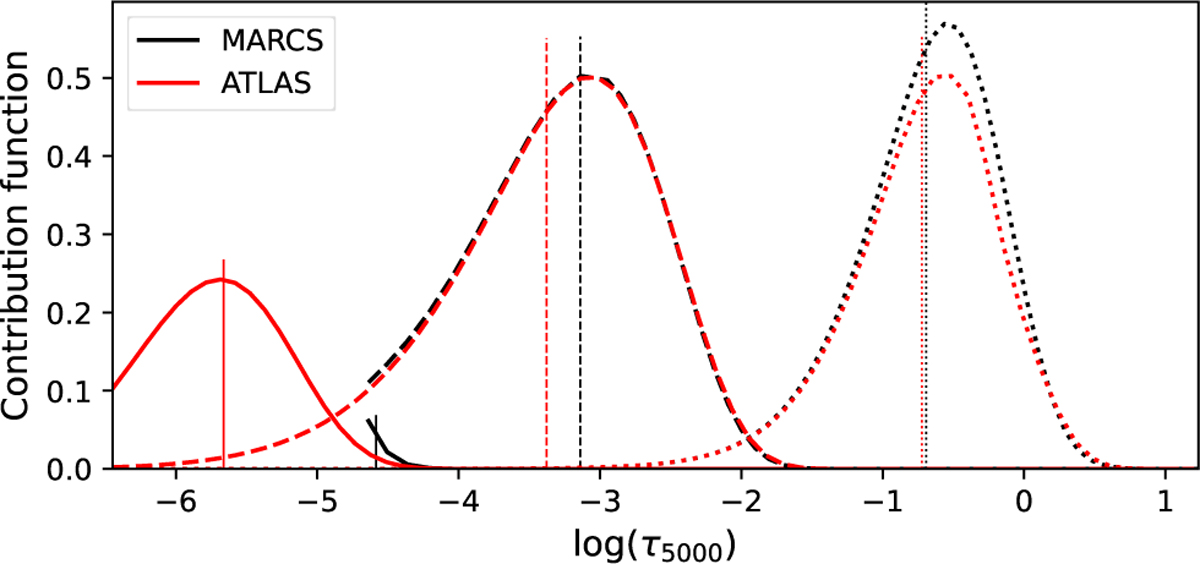
Comparison of the contribution functions for the Fe i 5434.52 Å line determined using ATLAS 12 (red lines) and MARCS (black lines) model atmospheres. The solid lines represent the line core, dashed and dotted lines represent distances from the core of 0.05 and 0.25 A respectively. Vertical lines correspond to centre of gravity for each contribution function. Note that the contribution functions for the MARCS model spectrum are cut off at the top of the MARCS model.
Current usage metrics show cumulative count of Article Views (full-text article views including HTML views, PDF and ePub downloads, according to the available data) and Abstracts Views on Vision4Press platform.
Data correspond to usage on the plateform after 2015. The current usage metrics is available 48-96 hours after online publication and is updated daily on week days.
Initial download of the metrics may take a while.