Fig. A.3.
Download original image
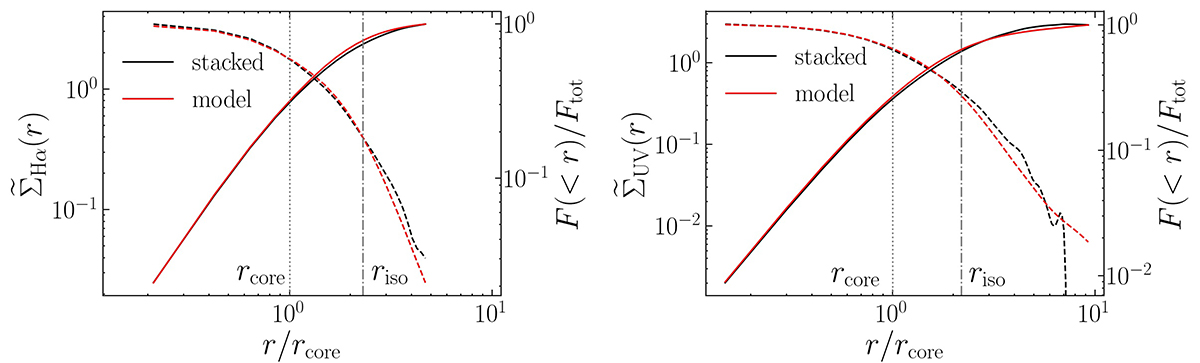
Comparison between the stacked profile (black lines) and the best-fitting model (red lines) both in the case of Hα (top panel) and UV (bottom panel). The dashed lines show the surface brightness (left y-scale), the solid lines show the cumulative normalized flux (right y-scale). The vertical grey dotted and dash-dotted lines are the core and isophotal radii of the stacked profile.
Current usage metrics show cumulative count of Article Views (full-text article views including HTML views, PDF and ePub downloads, according to the available data) and Abstracts Views on Vision4Press platform.
Data correspond to usage on the plateform after 2015. The current usage metrics is available 48-96 hours after online publication and is updated daily on week days.
Initial download of the metrics may take a while.