Fig. A.1.
Download original image
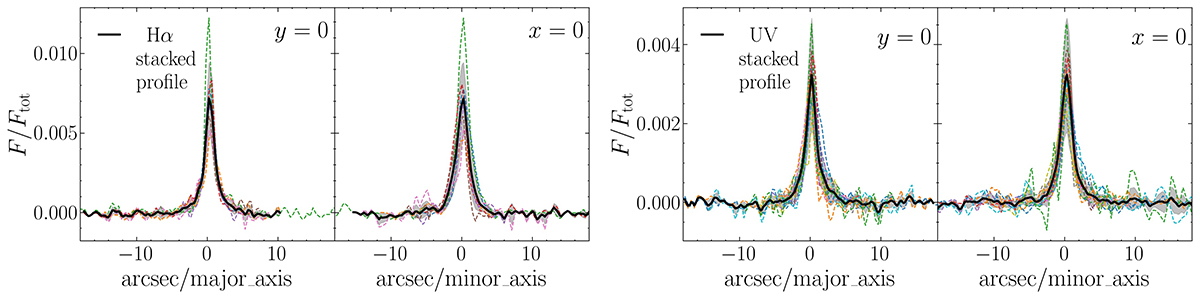
The normalized fluxes at y = 0 (left panels) and x = 0 (right panels) axis of the Hα-resolved (top row) and UV-resolved (bottom row) clumps selected for the stacking (dashed lines of varying colours) and the corresponding stacked clump (black solid line). The grey shaded area is the 1σ uncertainty of the stacked profile. The axes are normalized for scale quantities as described in Sect. A.
Current usage metrics show cumulative count of Article Views (full-text article views including HTML views, PDF and ePub downloads, according to the available data) and Abstracts Views on Vision4Press platform.
Data correspond to usage on the plateform after 2015. The current usage metrics is available 48-96 hours after online publication and is updated daily on week days.
Initial download of the metrics may take a while.