Fig. 4.
Download original image
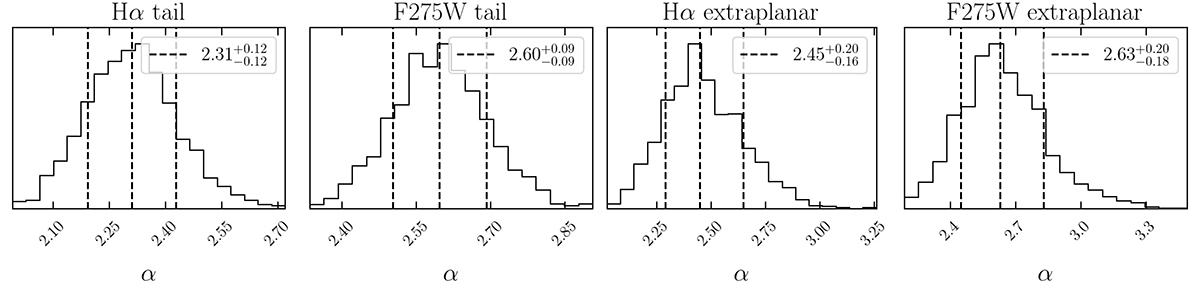
Posterior distribution of the slope parameters α, inferred fitting a power law to the mass distribution of tail clumps (first two panels) and extraplanar clumps (last two panels). Hα is on the left, and UV is on the right. The vertical dashed black lines are the 16th, 50th, and 84th percentiles, also reported in the legends.
Current usage metrics show cumulative count of Article Views (full-text article views including HTML views, PDF and ePub downloads, according to the available data) and Abstracts Views on Vision4Press platform.
Data correspond to usage on the plateform after 2015. The current usage metrics is available 48-96 hours after online publication and is updated daily on week days.
Initial download of the metrics may take a while.