Fig. 2.
Download original image
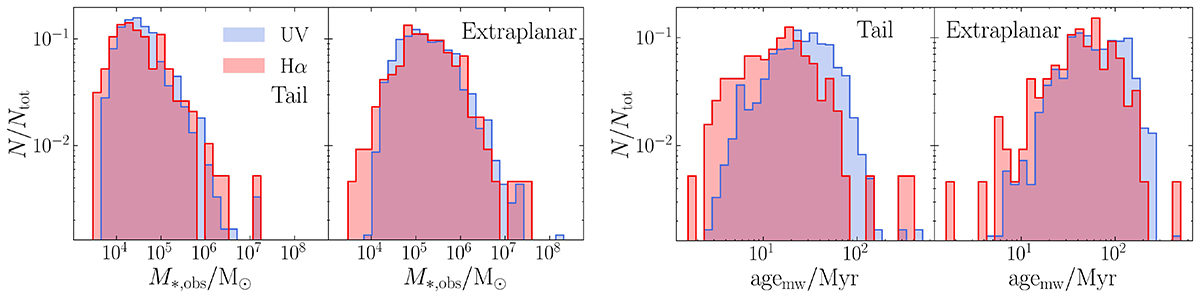
Stellar mass (top row) and mass-weighted age (bottom row) distributions of Hα (red histograms) and UV (blue histograms) clumps. The clumps were divided into tail (left panels) and extraplanar (right panels) according to the criteria described in Sect. 2.1, and the sample was selected following the procedure described in Sect. 2.3.
Current usage metrics show cumulative count of Article Views (full-text article views including HTML views, PDF and ePub downloads, according to the available data) and Abstracts Views on Vision4Press platform.
Data correspond to usage on the plateform after 2015. The current usage metrics is available 48-96 hours after online publication and is updated daily on week days.
Initial download of the metrics may take a while.