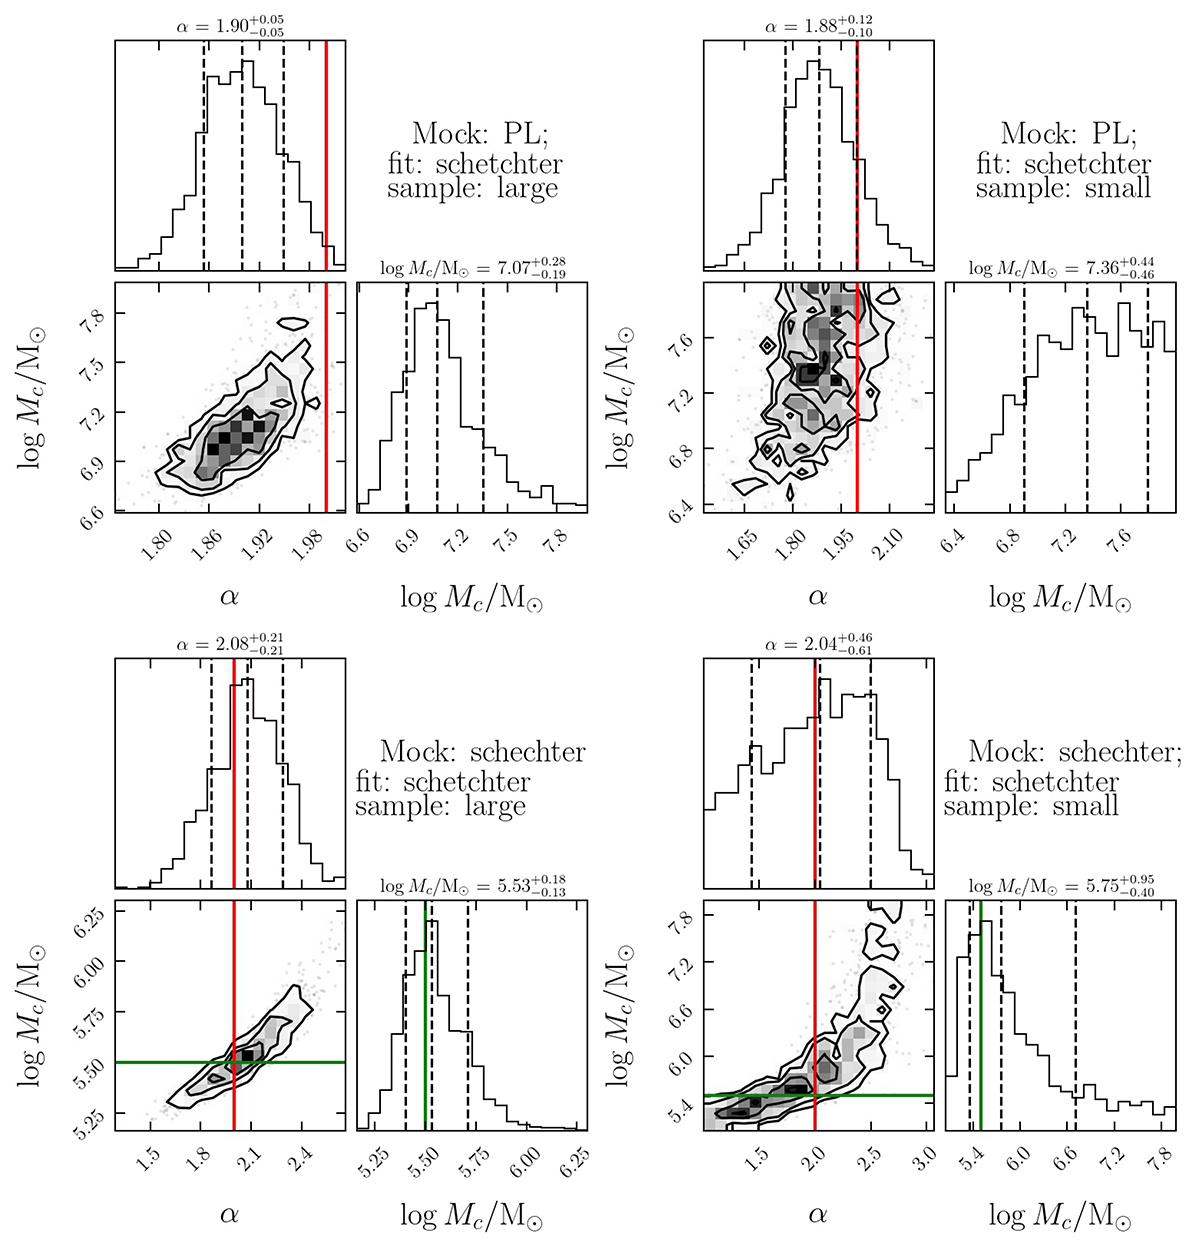
Fig. G.2.
Download original image
Corner plots of the parameter space (α, log Mc) (the slope and the cut-off mass, respectively), obtained fitting a Schechter mass function to a sample of mock clumps extracted either from a power-law (top row) or a Schechter (bottom row) function. The plots to the left refer to cases in which the fitted sample was large (∼1000 objects), while for those to the right the sample was small (∼100 objects). The red line marks the input slope of both the power-law and the Schechter mock distributions (α = 2). The green line marks the cut-off mass (log Mc/M⊙), which is present only in the case of the Schechter. Values on top of each histogram are the median of each distribution for the corresponding parameter, with uncertainties given by the 84th percentile minus the median and the median minus the 16th percentile (upper and lower uncertainty, respectively). The same values are also reported as black dashed vertical lines in the histograms.
Current usage metrics show cumulative count of Article Views (full-text article views including HTML views, PDF and ePub downloads, according to the available data) and Abstracts Views on Vision4Press platform.
Data correspond to usage on the plateform after 2015. The current usage metrics is available 48-96 hours after online publication and is updated daily on week days.
Initial download of the metrics may take a while.