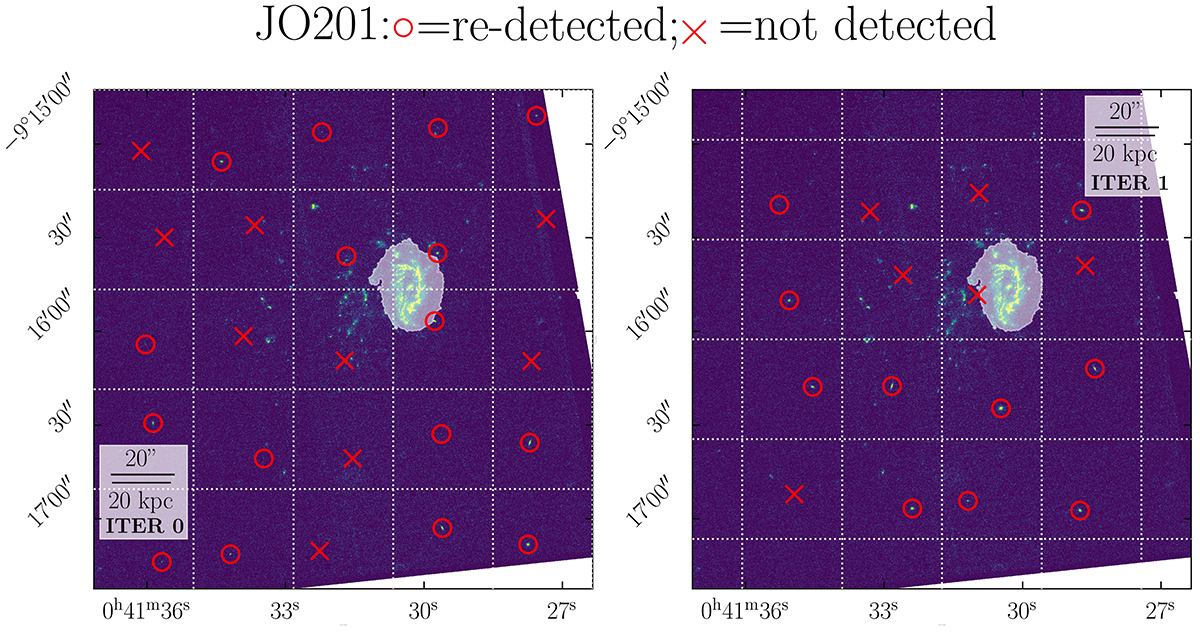
Fig. E.1.
Download original image
First two F275W mock images generated for JO201 following the prescription in Sect. E. The white dotted lines define the grid in which the FOV is divided, while the white shaded area is the optical disk (Sect. 2.1). The mock clumps that are added to the real images are inside a red circle if they got re-detected, otherwise they are marked by a red cross.
Current usage metrics show cumulative count of Article Views (full-text article views including HTML views, PDF and ePub downloads, according to the available data) and Abstracts Views on Vision4Press platform.
Data correspond to usage on the plateform after 2015. The current usage metrics is available 48-96 hours after online publication and is updated daily on week days.
Initial download of the metrics may take a while.