Fig. B.2.
Download original image
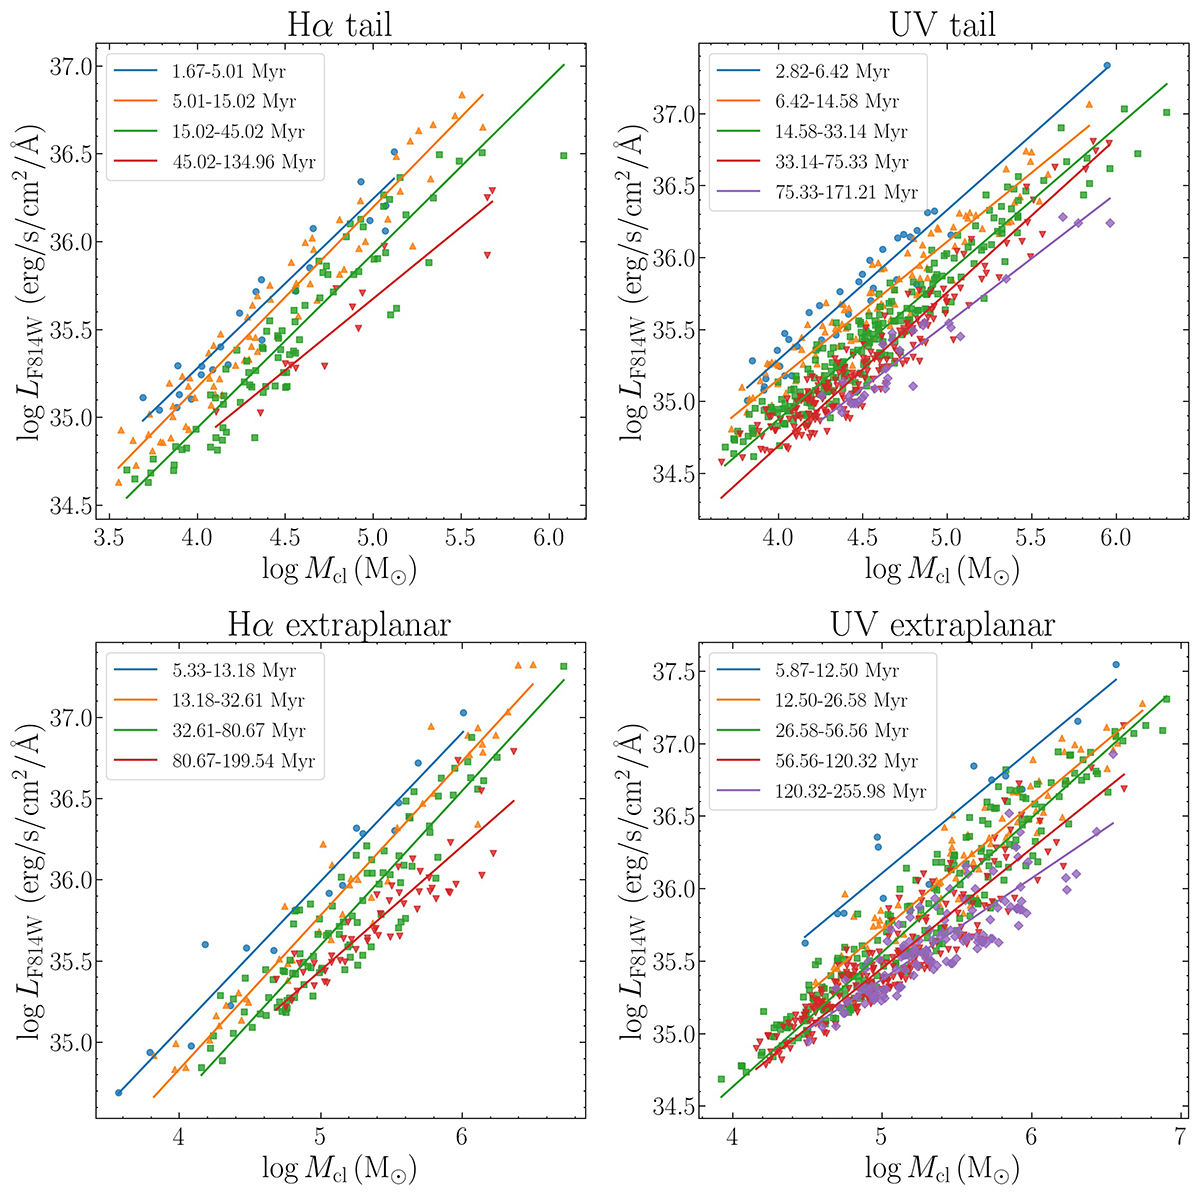
Clumps log LF814W − log Mcl plane (top row for tail clumps, bottom row for extraplanar clumps, Hα clumps in the left panels, UV clumps in the right panels). The clumps are divided in age bins as described in Sect. B.1 and plotted with different colours and shapes (see the legend). For each age bin, a linear fit to the clumps log LF814W − log Mcl is performed and plotted as solid line of the corresponding bin.
Current usage metrics show cumulative count of Article Views (full-text article views including HTML views, PDF and ePub downloads, according to the available data) and Abstracts Views on Vision4Press platform.
Data correspond to usage on the plateform after 2015. The current usage metrics is available 48-96 hours after online publication and is updated daily on week days.
Initial download of the metrics may take a while.