Open Access
Fig. A.1
Download original image
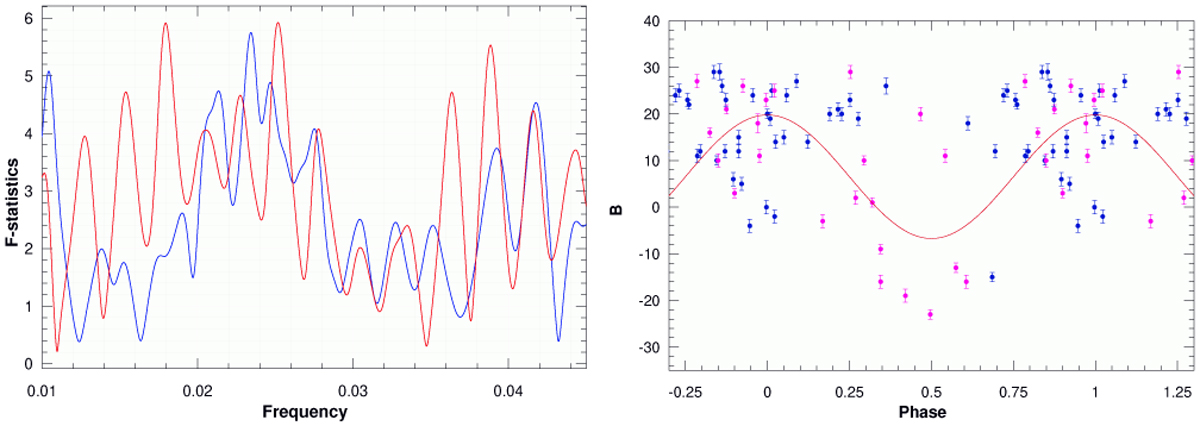
Periodogram based on all Narval measurements from the years 2011 and 2012 (left). The red line is used for the observations and the blue line for the window function. ⟨Bz⟩ measurements phased with P = 51.6 ± 1.1 d (right). The sinusoidal fit is shown with the red line.
Current usage metrics show cumulative count of Article Views (full-text article views including HTML views, PDF and ePub downloads, according to the available data) and Abstracts Views on Vision4Press platform.
Data correspond to usage on the plateform after 2015. The current usage metrics is available 48-96 hours after online publication and is updated daily on week days.
Initial download of the metrics may take a while.