Fig. 3
Download original image
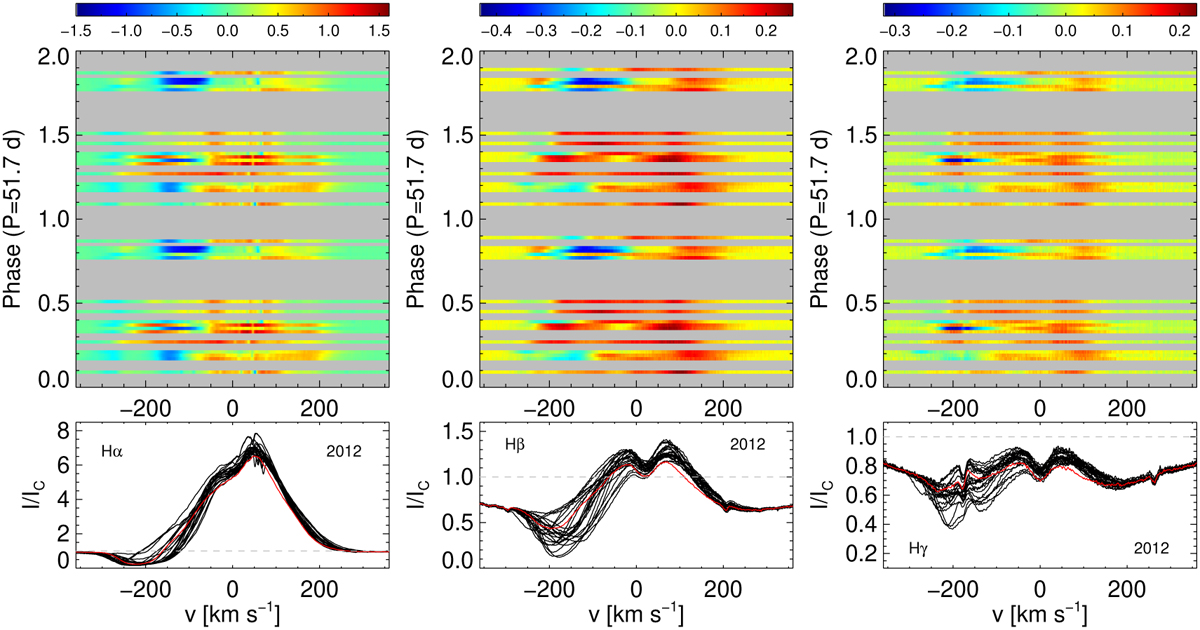
Dynamical spectra for the data acquired in 2012. Observed Narval 2012 overplotted line profiles (bottom panels) of Hα (left), Hβ (middle), and Hγ (right), and dynamical spectra of differences between the individual hydrogen line profiles and the profile with the lowest core emission highlighted by the red colour. The phases are based on the period determined in Sect. 3, Prot = 51.7 d.
Current usage metrics show cumulative count of Article Views (full-text article views including HTML views, PDF and ePub downloads, according to the available data) and Abstracts Views on Vision4Press platform.
Data correspond to usage on the plateform after 2015. The current usage metrics is available 48-96 hours after online publication and is updated daily on week days.
Initial download of the metrics may take a while.