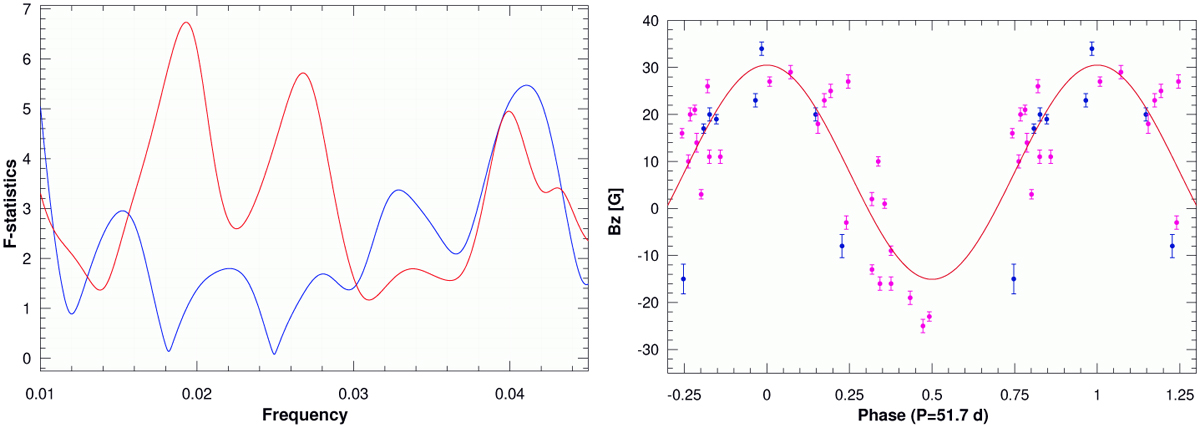
Fig. 2
Download original image
Periodogram and the magnetic phase curve for the period P = 51.7 ± 0.06 d. Left: periodogram based on all Narval and one ESPaDOnS ⟨Bz⟩ measurements from 2012 and eight HARPSpol ⟨Bz⟩ measurements recorded until 2019. The red line is for observations and the blue line for the window function. Right: ⟨Bz⟩ measurements (magenta circles for Narval and ESPaDOnS and blue circles for HARPS) phased with P = 51.7 ± 0.06 d. The sinusoidal fit is shown with the red line.
Current usage metrics show cumulative count of Article Views (full-text article views including HTML views, PDF and ePub downloads, according to the available data) and Abstracts Views on Vision4Press platform.
Data correspond to usage on the plateform after 2015. The current usage metrics is available 48-96 hours after online publication and is updated daily on week days.
Initial download of the metrics may take a while.