Fig. C.2
Download original image
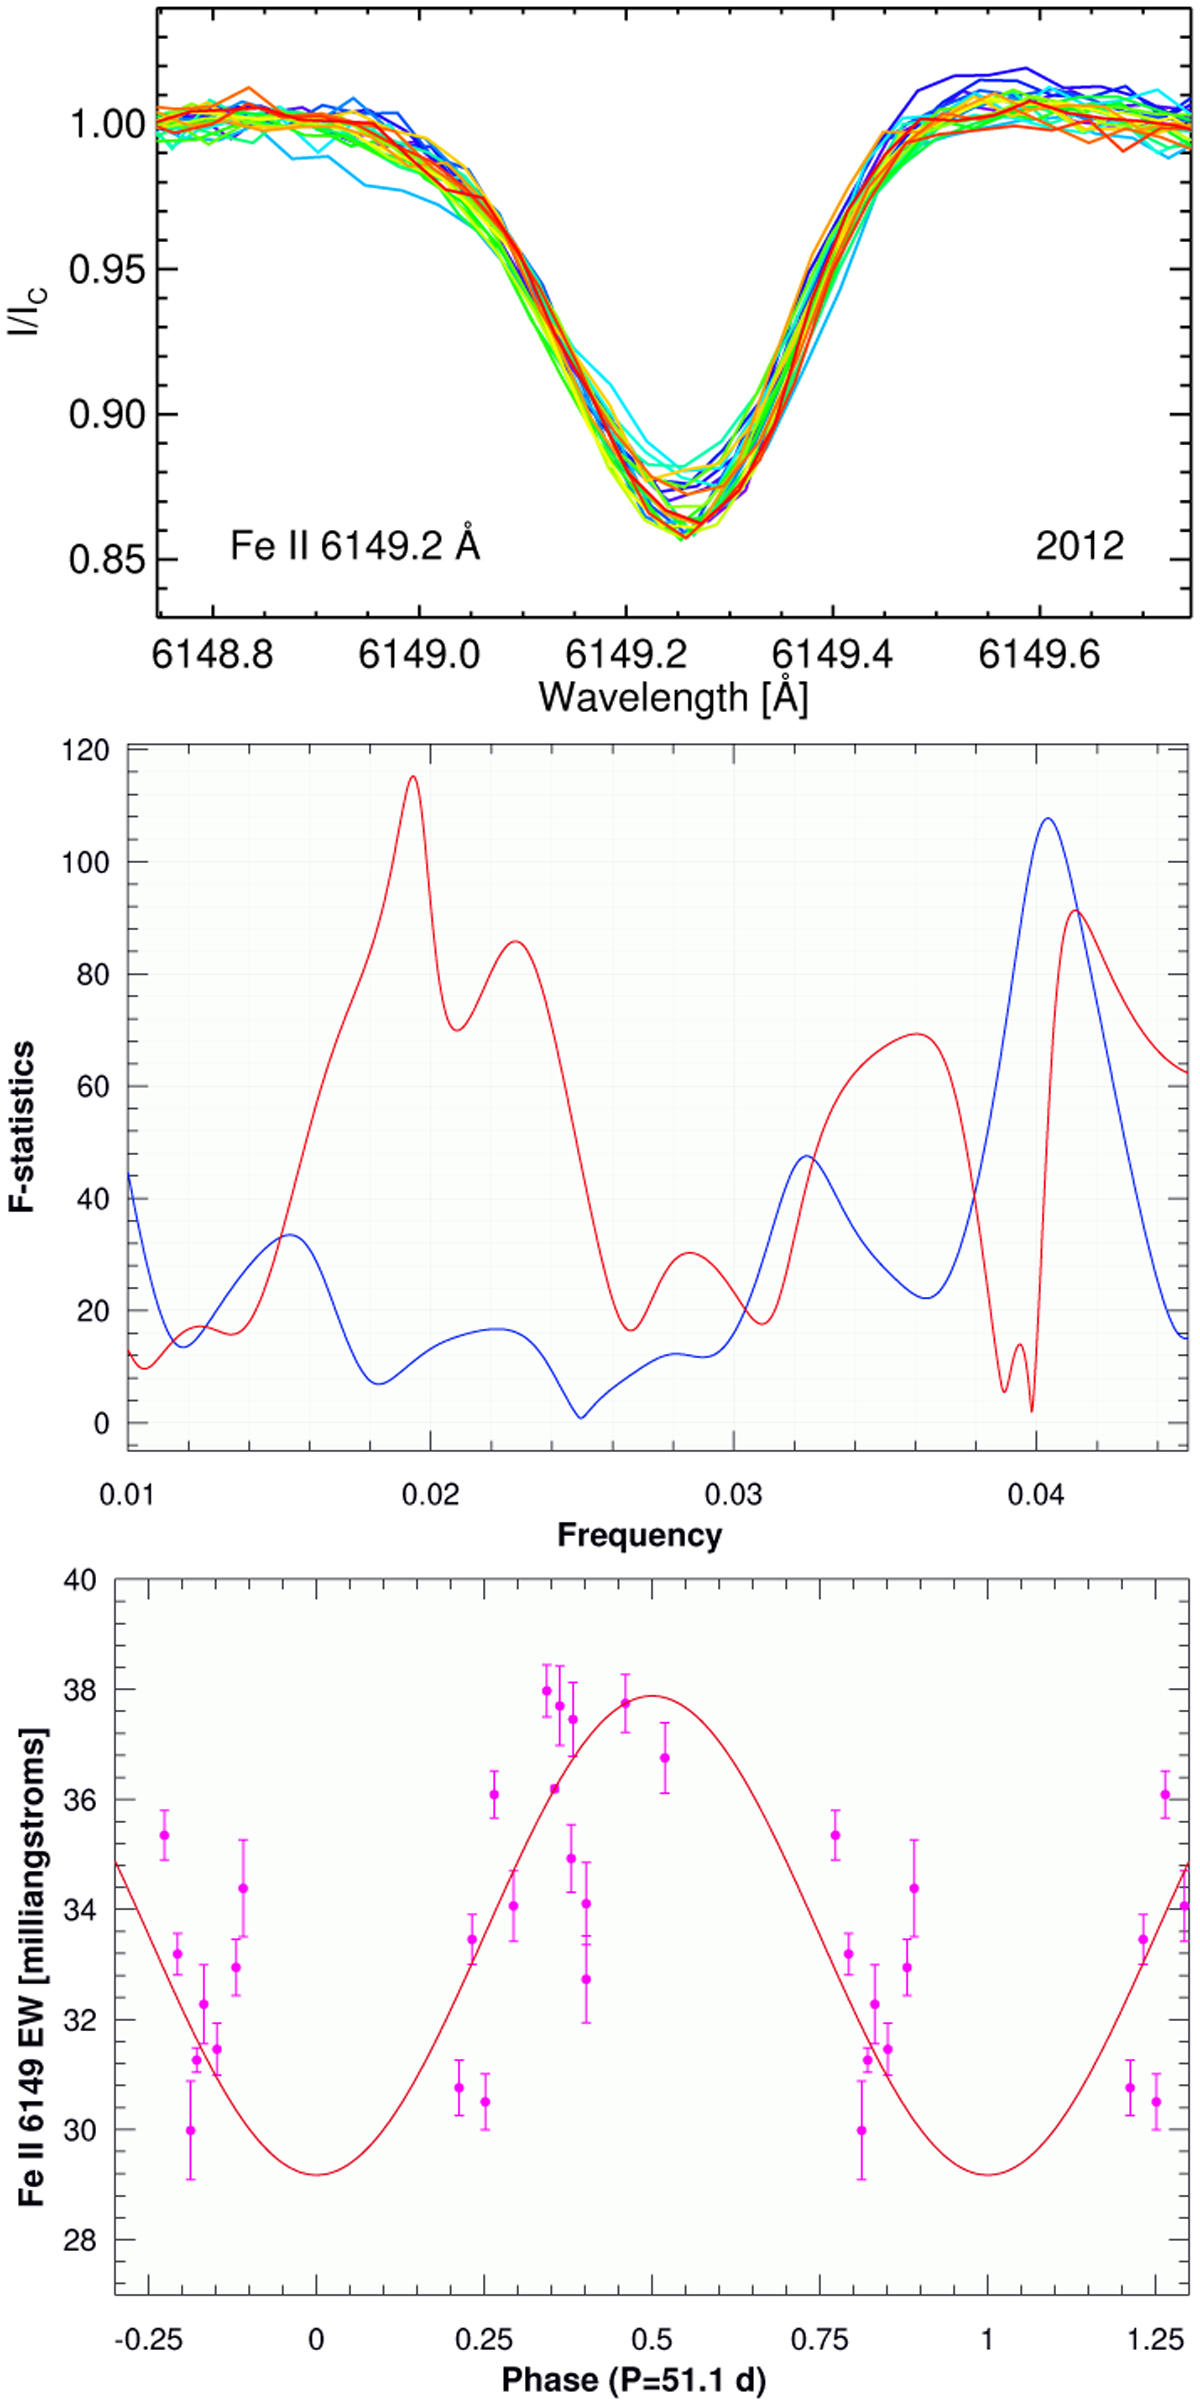
Variability of the Fe II 6149 Å lines. Top: 2012 Narval line profiles overplotted for Fe II 6149 Å. Middle: periodogram based on EWs measured from the profiles shown in the top panel. The red line is for the observations and the blue line for the window function. Bottom: magenta circles represent EWs measured from the 2012 Narval spectra using the Fe II 6149 Å line and are phased with P = 51.1 d. The obtained period is slightly shorter than the one obtained from the mean longitudinal magnetic field measurements, but within the errors still similar. The sinusoidal fit is shown with the red line.
Current usage metrics show cumulative count of Article Views (full-text article views including HTML views, PDF and ePub downloads, according to the available data) and Abstracts Views on Vision4Press platform.
Data correspond to usage on the plateform after 2015. The current usage metrics is available 48-96 hours after online publication and is updated daily on week days.
Initial download of the metrics may take a while.