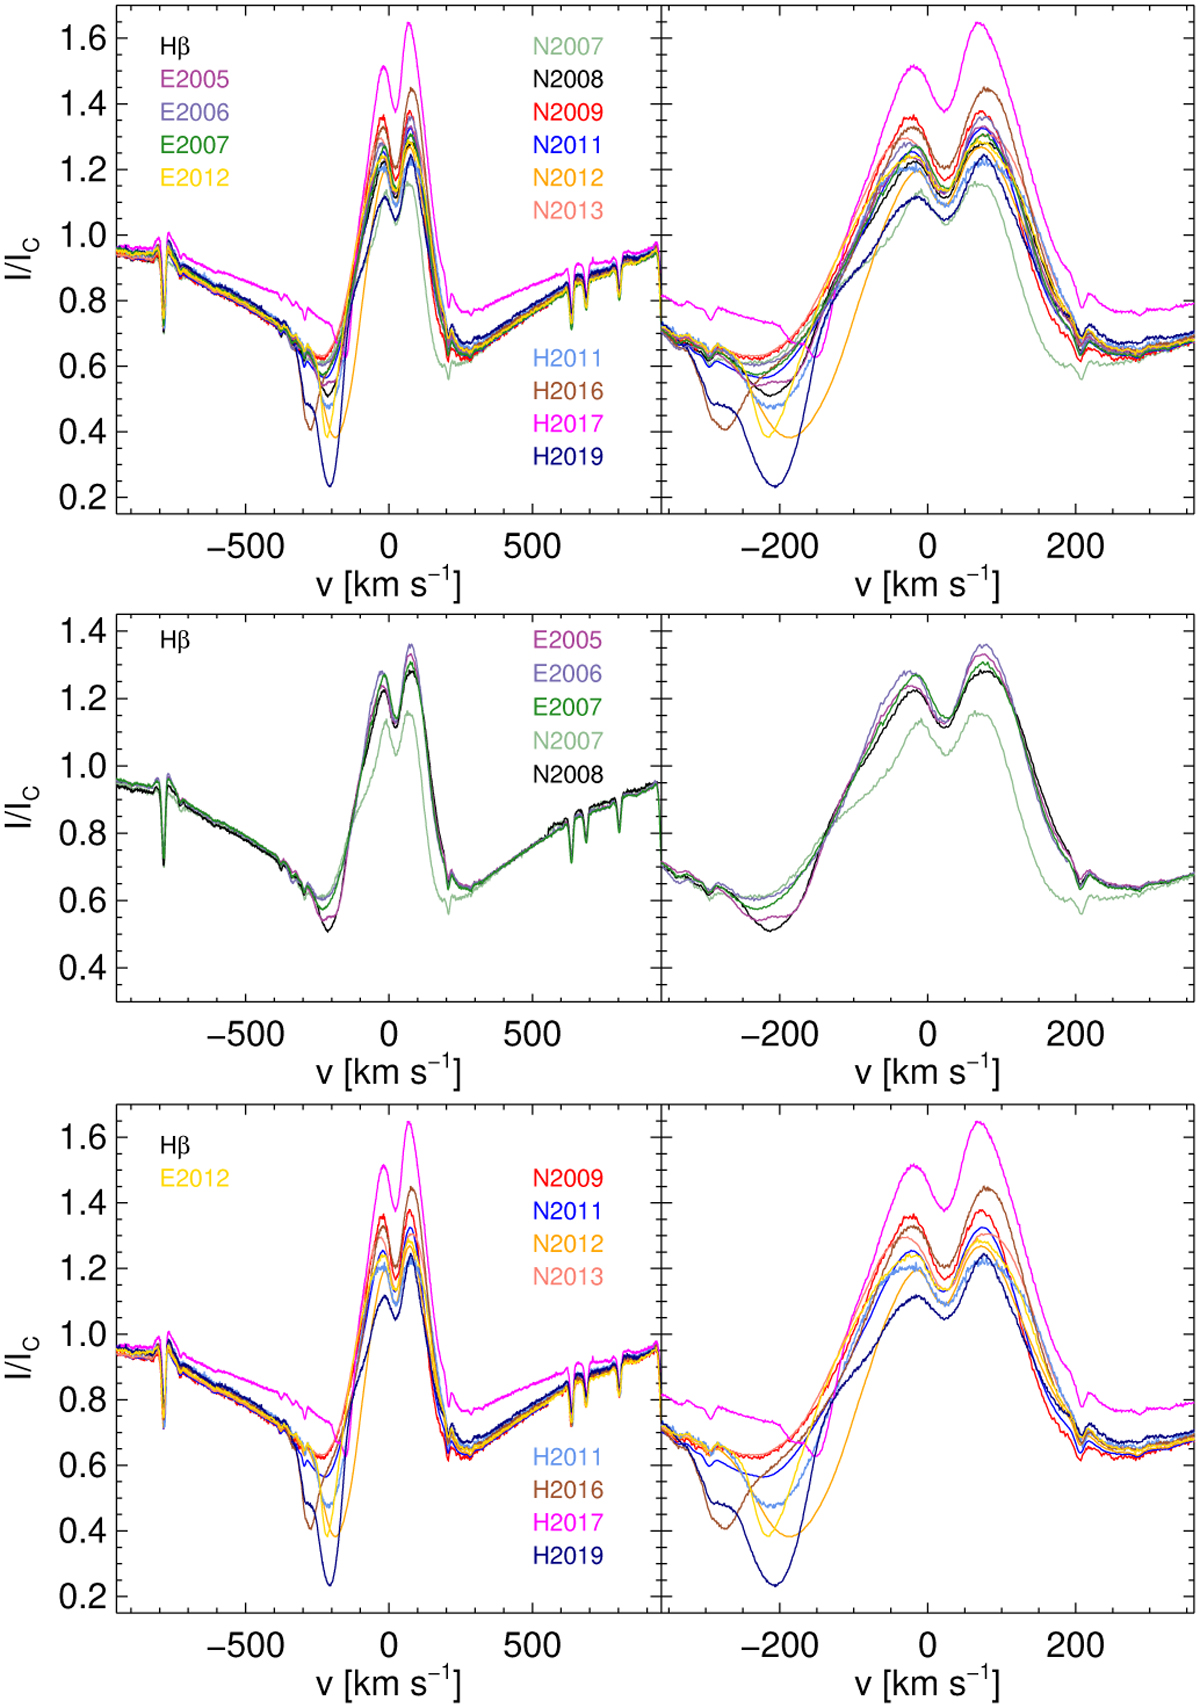
Fig. B.1

Download original image
Variability of Hβ profiles over different years. Top: the observations have been acquired from 2005 to 2019 using different instruments: E indicates ESPaDOnS, N Narval, and H HARPSpol. Left: larger velocity range to show the full extent of the line profiles. Right: zoom-in to the line core. The profile in magenta with the strongest emission contribution refers to the HARPSpol observation in 2017 whereas the profile in navy blue colour highlights the HARPSpol observation in 2019. The middle plot shows the profiles until 2008 and the bottom plot the profiles of the later years.
Current usage metrics show cumulative count of Article Views (full-text article views including HTML views, PDF and ePub downloads, according to the available data) and Abstracts Views on Vision4Press platform.
Data correspond to usage on the plateform after 2015. The current usage metrics is available 48-96 hours after online publication and is updated daily on week days.
Initial download of the metrics may take a while.


