Open Access
Fig. 1
Download original image
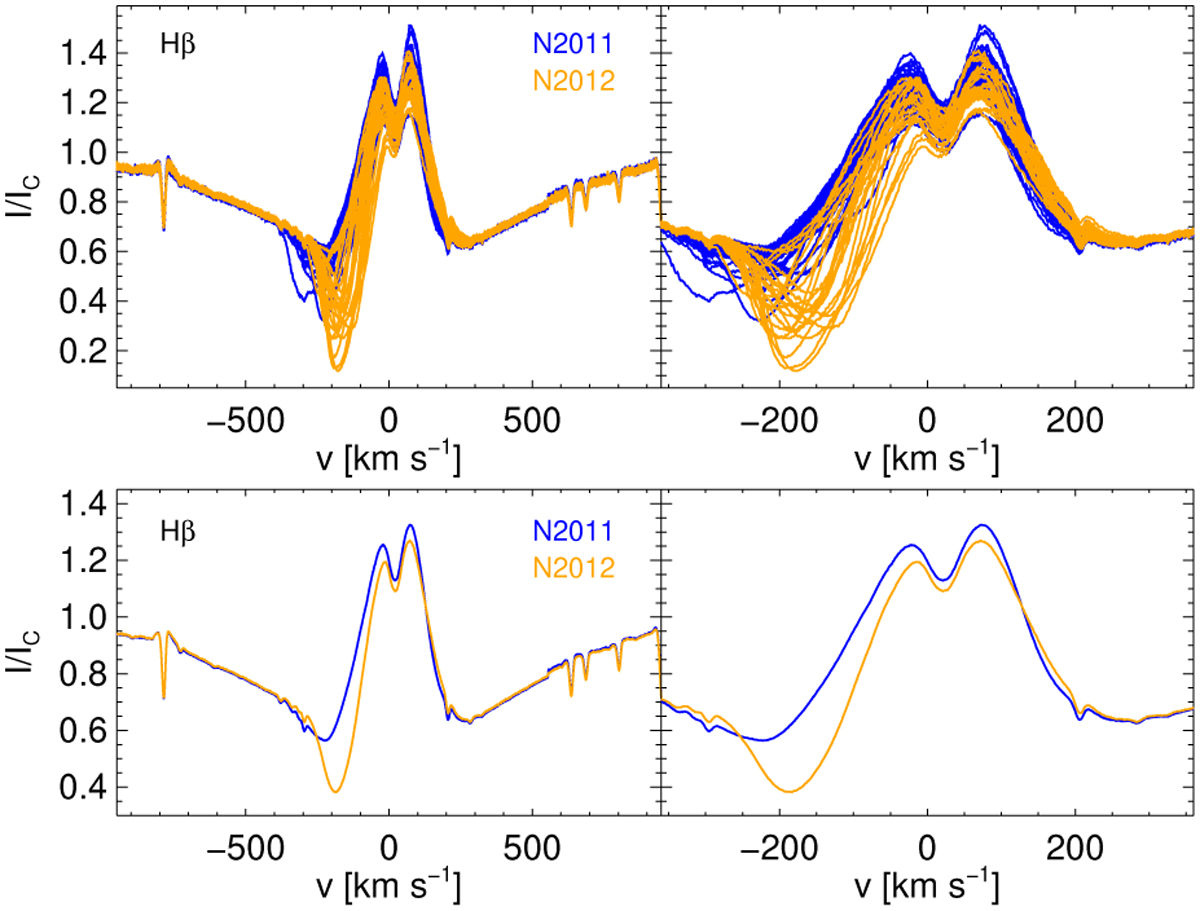
Variability of Hβ profiles in Narval observations. Top panels: overplotted Narval Hβ profiles from 2011 (blue) and 2012 (yellow). Bottom panels: mean Hβ profiles for both years. The plots on the left panels include the full wings of the Hβ line whereas the plots on the right side show the central part of the profiles.
Current usage metrics show cumulative count of Article Views (full-text article views including HTML views, PDF and ePub downloads, according to the available data) and Abstracts Views on Vision4Press platform.
Data correspond to usage on the plateform after 2015. The current usage metrics is available 48-96 hours after online publication and is updated daily on week days.
Initial download of the metrics may take a while.