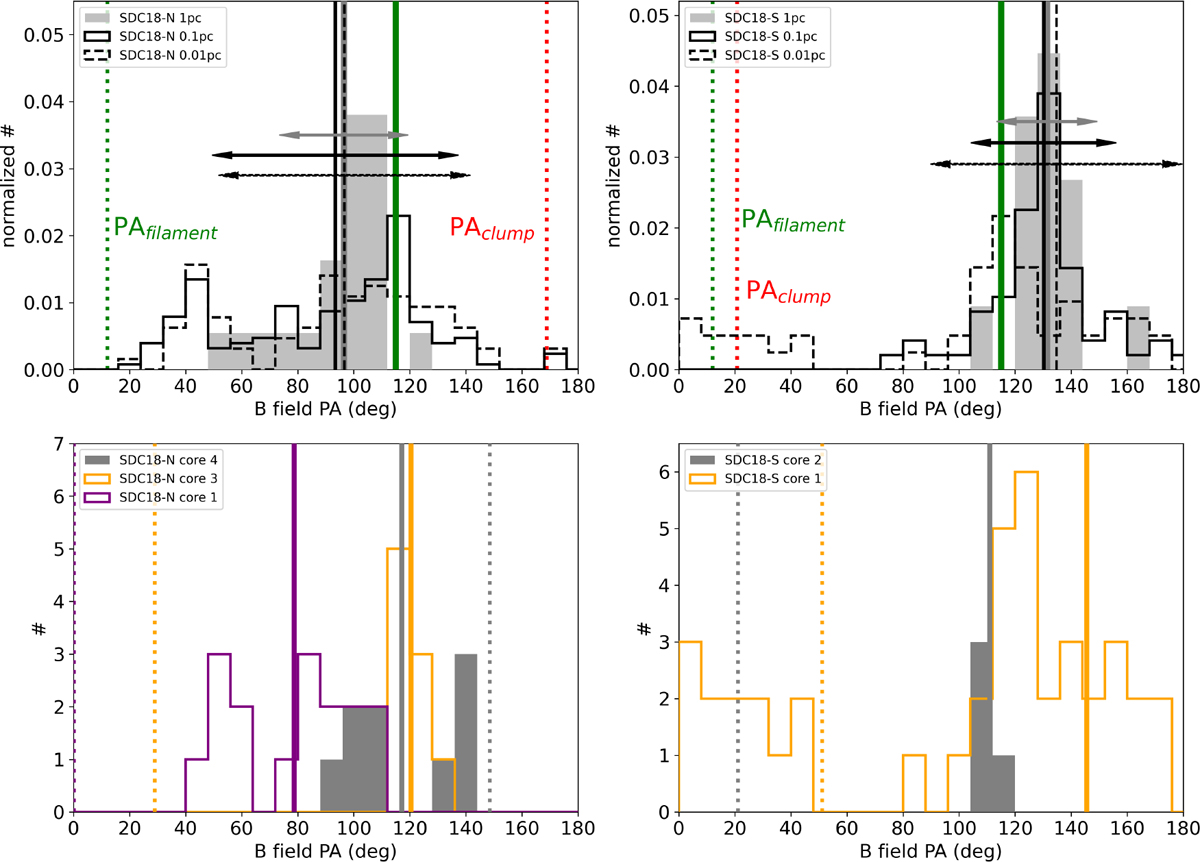
Fig. 9
Download original image
Top: Histograms of the magnetic field position angles (PAs) within the defined boundaries of SDC18-N (left) and SDC18-S (right) at various scales. The gray solid, black solid, and black dashed lines and arrows indicate the circular mean and angular dispersion of the magnetic field at filament-embedded clump (~ 1 pc), isolated clump (~ 0.1 pc), and clump-embedded core (~ 0.01 pc) scale. The solid green line is the circular mean magnetic field orientation over the entire 10 pc filament. The green and red dotted lines mark the PAs of the major axes of the filament and clumps. Bottom: Histograms of the magnetic field PAs in individual clump-embedded cores at 0.01 pc scale from the SMA higher-resolution (~ 1.3ʺ) maps for SDC18-N (left) and SDC18-S (right). Different colors denote different cores marked in Figure 3. The solid and dotted lines mark the circular mean of the magnetic field and the PAs of the cores’ major axes. The angle differences between the mean magnetic field orientations and the major axes of the structures at different scales lie in the range of 90°–100°, signaling the consequence of anisotropic contraction where the B-field regulates the gas motion over multiple scales. The magnetic field also retains its overall mean orientation from filament to clumps and onward to embedded-core scale, with mean PA changes within about 20° to 30° across all scales for both SDC18-N and SDC18-S. Note: all PAs range from 0° to 180°, north to east. 0° and 180° mark identical orientations because of the 0° / 180° ambiguity for circular quantities such as PAs.
Current usage metrics show cumulative count of Article Views (full-text article views including HTML views, PDF and ePub downloads, according to the available data) and Abstracts Views on Vision4Press platform.
Data correspond to usage on the plateform after 2015. The current usage metrics is available 48-96 hours after online publication and is updated daily on week days.
Initial download of the metrics may take a while.