Fig. 6
Download original image
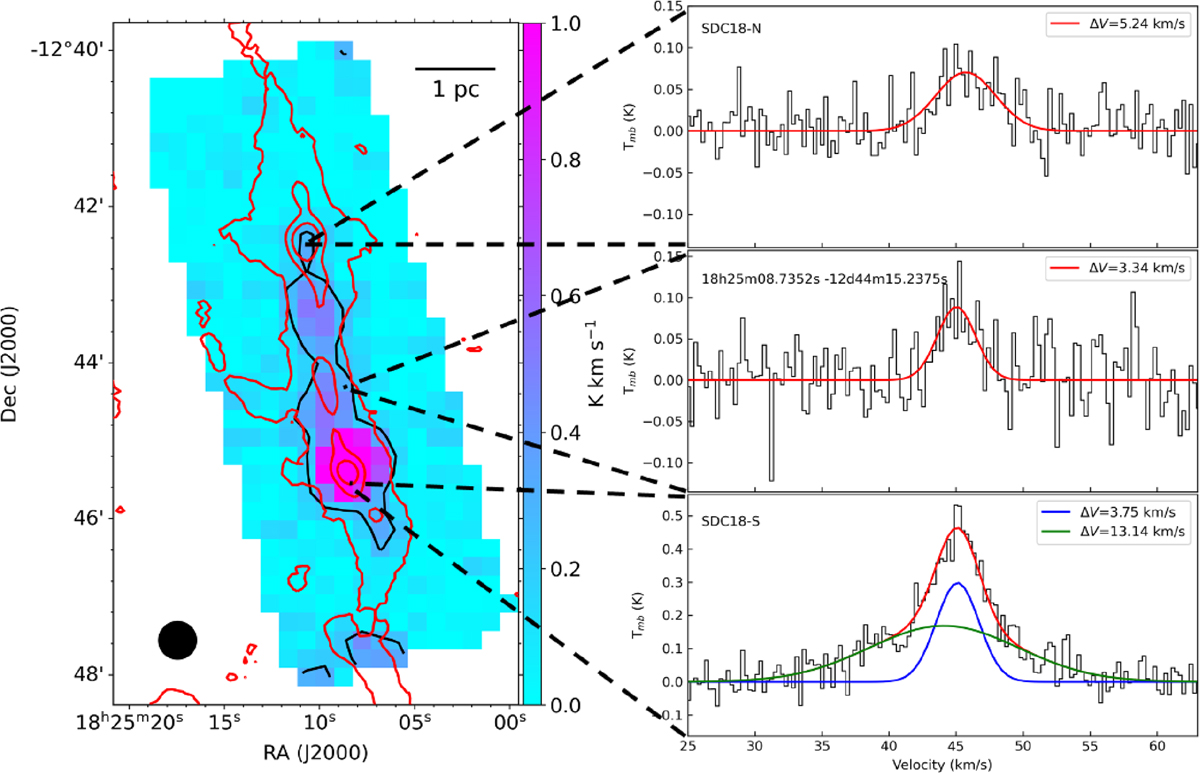
Left: SDC18 SiO (2–1) integrated intensity map from the IRAM-30m. The 3σ intensity level is marked by the black contour. Red contours show the same JCMT total intensity levels of 50, 500, and 1000 mJy/beam as in panel (a) in Figure 2. Right: Spectra extracted from several positions marked by the black dashed lines. In the upper two panels, the red lines are the single-Gaussian fits, while in the bottom panel, the red line is the combination of a two-component Gaussian fit including a broader and narrower component in green and blue, respectively.
Current usage metrics show cumulative count of Article Views (full-text article views including HTML views, PDF and ePub downloads, according to the available data) and Abstracts Views on Vision4Press platform.
Data correspond to usage on the plateform after 2015. The current usage metrics is available 48-96 hours after online publication and is updated daily on week days.
Initial download of the metrics may take a while.