Fig. 4
Download original image
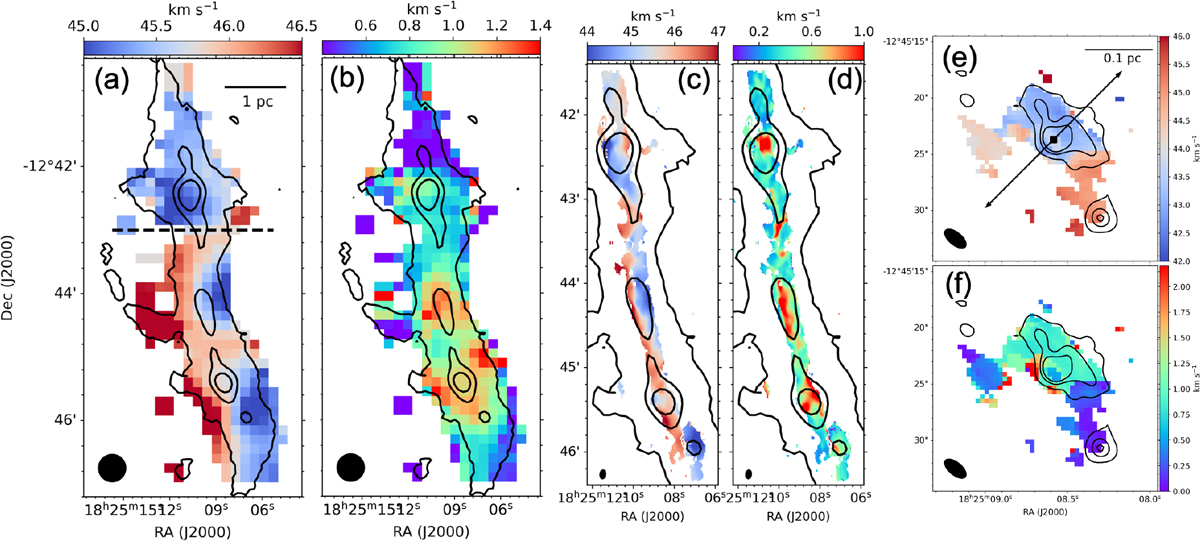
SDC18 N2H+ centroid velocity and dispersion maps at various scales. Panels (a) and (b) show the IRAM-30m N2H+ (1–0) centroid velocity and velocity dispersion map with a resolution of 27ʺ. The black dashed line in the first panel marks Dec = – 12°43ʹ00ʹʹ.0 where the direction of the velocity gradient flips. Panels (c) and (d) are the N2H+ (1–0) centroid velocity and velocity dispersion map with a beam size of 5.77ʺ × 3.39ʺ from the PdBI. Panels (e) and (f) are the N2H+ (3–2) centroid velocity and velocity dispersion map of SDC18-S observed by the SMA with a beam size of 2.28ʺ × 1.11ʺ. The same black contours representing JCMT total intensity levels at 50, 500, and 1000 mJy beam−1, identical to the left panel of Figure 2, are shown in the first four panels. The SMA total intensity contours of 7, 30, and 45σ (identical to the lower right panel of Figure 2) are shown in the two maps on the very right. In panel (e), a black dot and arrow mark the continuum peak and the outflow orientation in SDC18-S reported by Fallscheer et al. (2009).
Current usage metrics show cumulative count of Article Views (full-text article views including HTML views, PDF and ePub downloads, according to the available data) and Abstracts Views on Vision4Press platform.
Data correspond to usage on the plateform after 2015. The current usage metrics is available 48-96 hours after online publication and is updated daily on week days.
Initial download of the metrics may take a while.