Fig. 3
Download original image
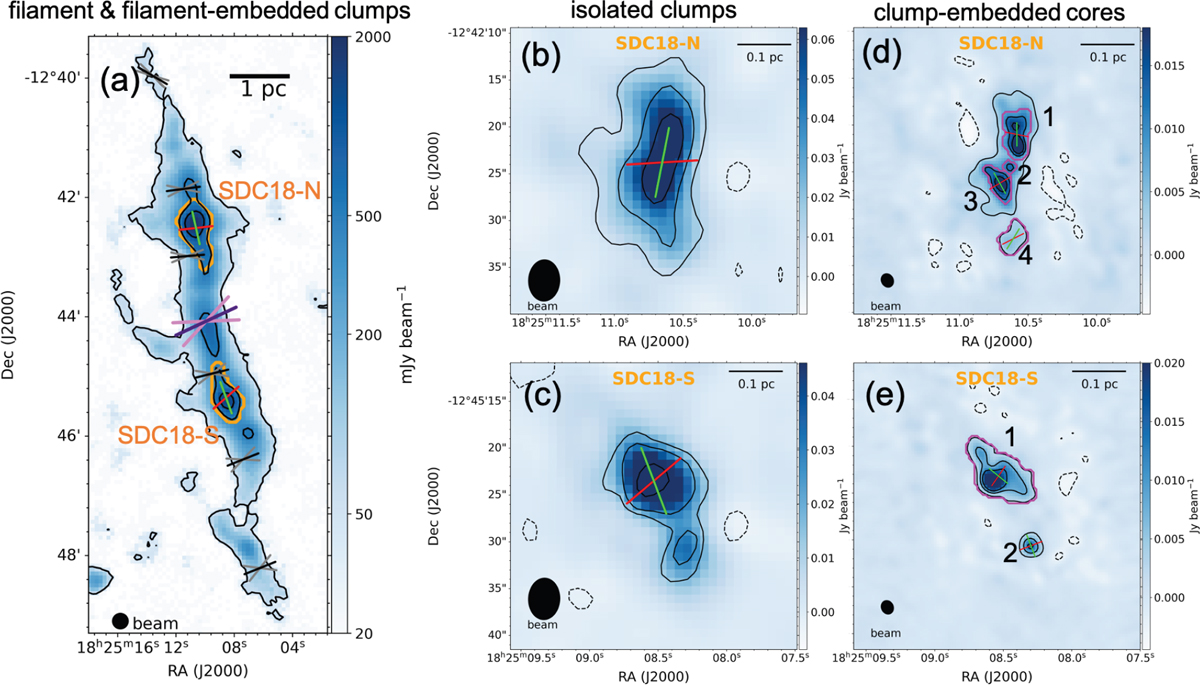
Circular mean magnetic field orientations in different regions and scales of SDC18. The black segments in panel (a) show the magnetic field orientations averaged within boxes of 100ʺ × 100ʺ along the filament ridge, overplotted on the JCMT continuum map. The intersection angles of the grey segments are the dispersion values of the field orientations. The locations of the segments are the average locations of the detected polarization signals within each box. The purple segment and intersection angle of the violet segments show the overall circular mean of 115° with its dispersion of 45° of the magnetic field orientations within the entire filament. The red and green segments in all panels present the mean magnetic field orientations and position angles of the major axes for the clumps and cores at different scales. Magenta contours mark the boundaries of the individual cores in the SMA 1.3ʺ resolution maps for SDC18-N (panel (d)) and SDC18-S (panel (e)) identified in Section 3.2.
Current usage metrics show cumulative count of Article Views (full-text article views including HTML views, PDF and ePub downloads, according to the available data) and Abstracts Views on Vision4Press platform.
Data correspond to usage on the plateform after 2015. The current usage metrics is available 48-96 hours after online publication and is updated daily on week days.
Initial download of the metrics may take a while.