Fig. 2
Download original image
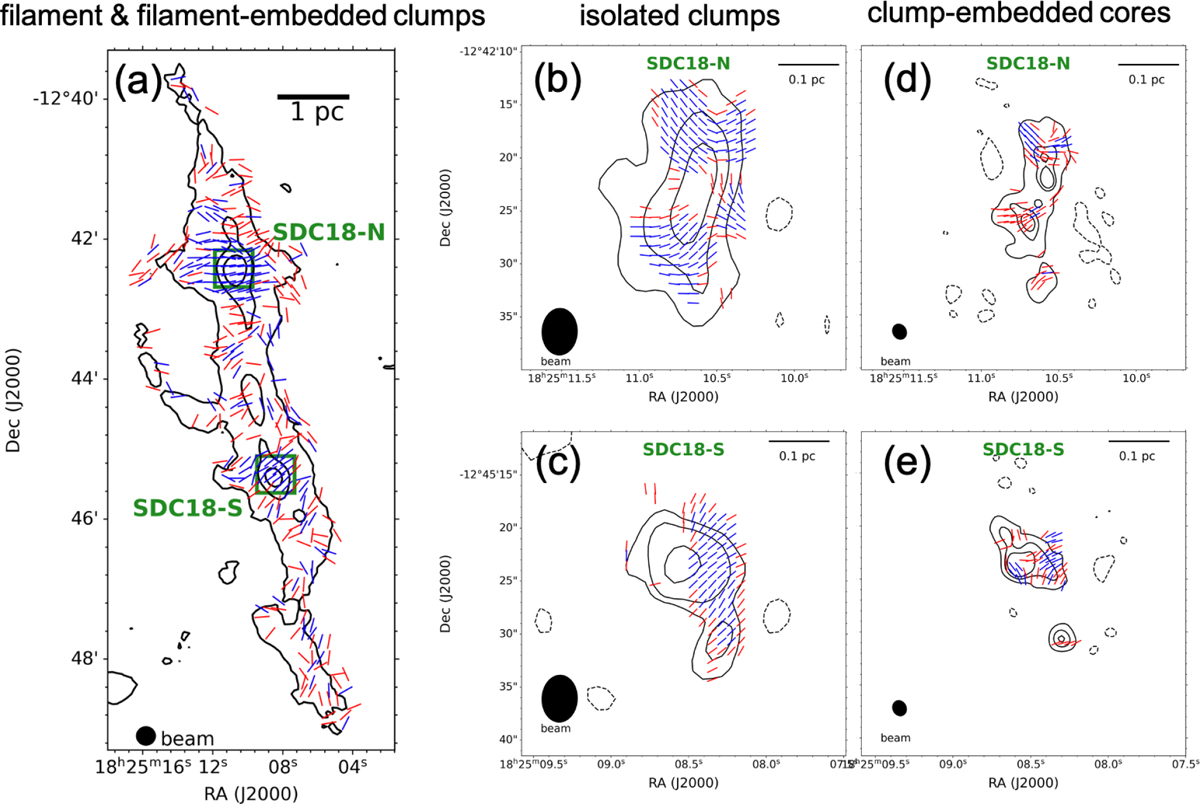
(a): SDC18 continuum emission at 850 μm with an angular resolution of 14.6ʺ with JCMT/POL-2 in contours and magnetic field segments, capturing the entire filament and the filament-embedded clumps, SDC18-N and SDC18-S (green boxes), zoomed in the middle and right panels. The contours are 50, 500, and 1000 mJy beam−1. (b), (c): Continuum emission at 1.3 mm in contours and magnetic field segments of SDC18-N (b) and SDC18-S (c) with an angular resolution of 4.41ʺ × 3.32ʺ with the SMA, capturing the isolated clumps resolving out diffuser and more extended emission. Solid black contours represent the Stokes I flux levels at 15, 40, and 80σI, while dashed black contours show -5σI. (d), (e): The same as the middle panels but with an angular resolution of 1.45ʺ × 1.25ʺ, capturing the clump-embedded cores revealing fragmentation of the larger clump. Solid black contours are 7, 30, and 45σI Stokes I flux levels, while dashed black contours are -7σI. The segments in all panels show magnetic field orientations with P > 3σP detections in blue and 3σP > P > 2σP detections in red. The right panels display magnetic field segments gridded at half of the synthesized beam resolution. The segments in the middle panels are overgridded for a sharper visualization, but only data at half of the synthesized beam are used for the further analysis.
Current usage metrics show cumulative count of Article Views (full-text article views including HTML views, PDF and ePub downloads, according to the available data) and Abstracts Views on Vision4Press platform.
Data correspond to usage on the plateform after 2015. The current usage metrics is available 48-96 hours after online publication and is updated daily on week days.
Initial download of the metrics may take a while.