Fig. B.1
Download original image
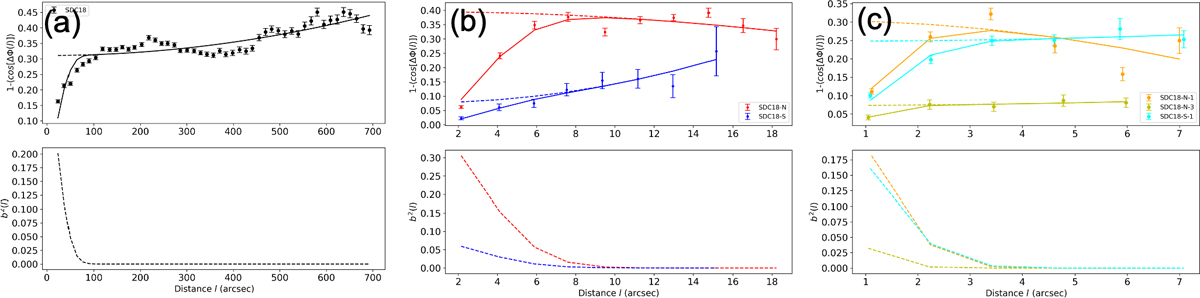
Top panels: Magnetic field structure functions as a function of distance l of SDC18 (black) at filament scale (black) in panel (a), and of SDC18-N (red) and SDC18-S (blue) at isolated clump scale in panel (b), and of SDC18-N-1 (orange), SDC18-N-3 (yellow) and SDC18-S-1 (cyan) at clump-embedded core scale in panel (c). Solid lines are the best fits of Equation 10. Dashed lines show the ordered component (![]() ) of the best fits. Bottom panels: correlated component (
) of the best fits. Bottom panels: correlated component (![]() ) of the best fits. Data are binned to half of the synthesized beam in the right panels (isolated clump scale and clump-embedded core scale) and to one beam in the left panels (filament and filament-embedded clump scale), and plotted at the average distance within a bin.
) of the best fits. Data are binned to half of the synthesized beam in the right panels (isolated clump scale and clump-embedded core scale) and to one beam in the left panels (filament and filament-embedded clump scale), and plotted at the average distance within a bin.
Current usage metrics show cumulative count of Article Views (full-text article views including HTML views, PDF and ePub downloads, according to the available data) and Abstracts Views on Vision4Press platform.
Data correspond to usage on the plateform after 2015. The current usage metrics is available 48-96 hours after online publication and is updated daily on week days.
Initial download of the metrics may take a while.