Fig. A.1
Download original image
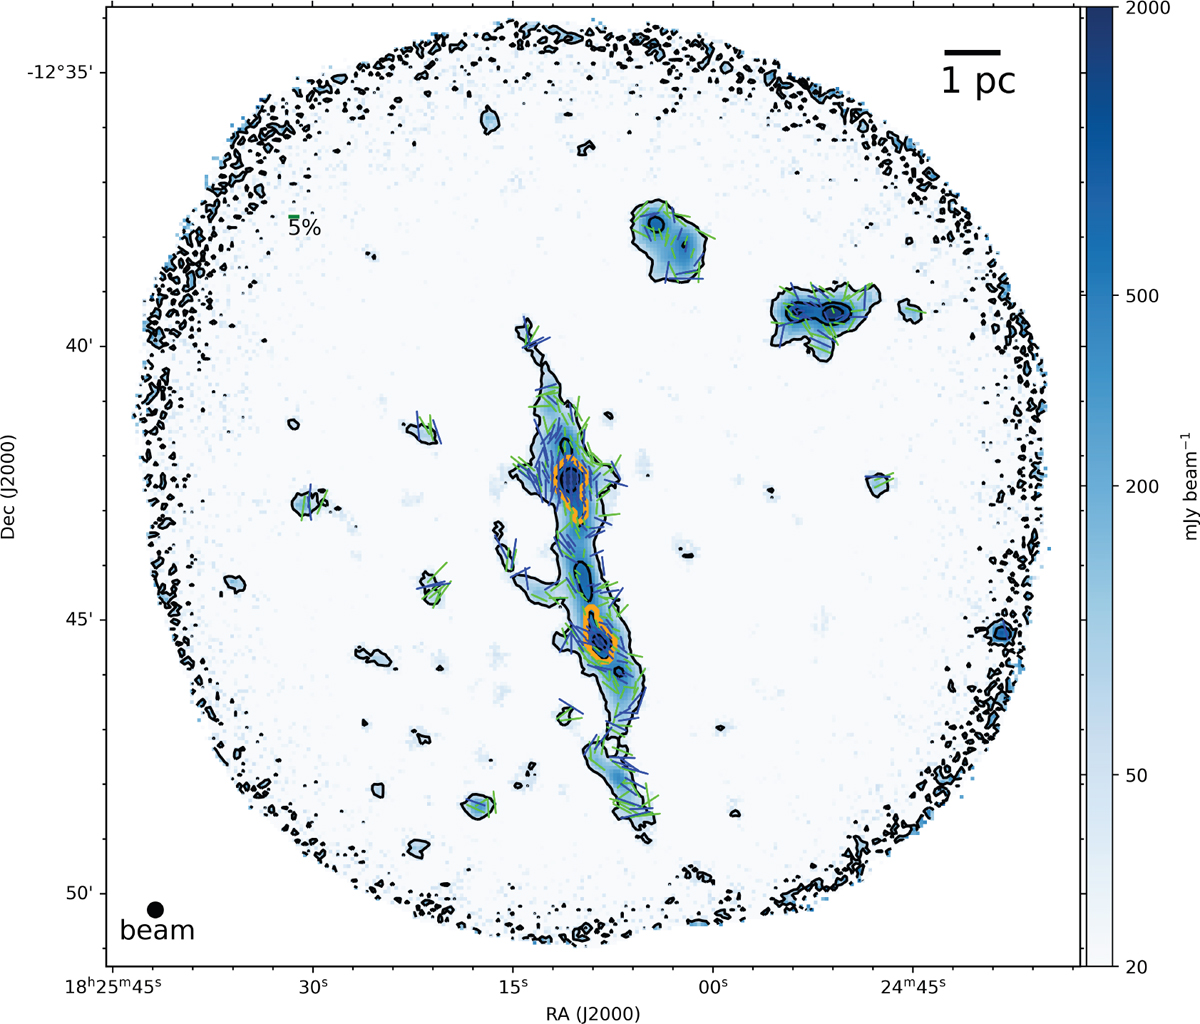
JCMT total intensity Stokes I map overlaid with polarization segments at 850 μm over the entire field of view (11’) of the JCMT. Blue segments show the polarization orientations with I > 5σI and P > 3σP, while green segments are I > 5σI and 3σP > P > 2σP. The lengths of the segments are proportional to ![]() . A reference scale bar of 5% is shown in the upper-left corner. The contours are 50, 500, and 1000 mJy beam−1 for the total intensity. Orange contours are the boundaries of SDC18-N and SDC18-S at filament scale determined by the dendrogram analysis.
. A reference scale bar of 5% is shown in the upper-left corner. The contours are 50, 500, and 1000 mJy beam−1 for the total intensity. Orange contours are the boundaries of SDC18-N and SDC18-S at filament scale determined by the dendrogram analysis.
Current usage metrics show cumulative count of Article Views (full-text article views including HTML views, PDF and ePub downloads, according to the available data) and Abstracts Views on Vision4Press platform.
Data correspond to usage on the plateform after 2015. The current usage metrics is available 48-96 hours after online publication and is updated daily on week days.
Initial download of the metrics may take a while.